Your example is not reproducible, I have tried to make it work based on this other similar topic, I think this could work as a reprex for your issue and as a starting point.
library(tidyverse)
library(vegan)
library(multcompView)
library(car)
TRY2 <- data.frame(stringsAsFactors = FALSE,
Tissue=c("Panicle", "Flag leaf", "Root", "Panicle", "Flag leaf",
"Root", "Root", "Flag leaf", "Panicle", "Panicle",
"Root", "Panicle", "Flag leaf", "Flag leaf", "Flag leaf",
"Root", "Panicle", "Root", "Panicle", "Root", "Panicle",
"Panicle", "Panicle", "Flag leaf", "Panicle"),
Genotype= c("N22", "N22", "N22", "IR64", "IR64", "IR64", "N22",
"IR64", "IR64", "IR64", "N22", "N22", "N22", "IR64",
"N22", "IR64", "IR64", "N22", "N22", "IR64", "N22",
"N22", "IR64", "IR64", "N22"),
Value= c(1.0000000, 0.5000000, 1.0000000, 0.7000000, 0.7500000,
1.0000000, 0.8000000, 1.0000000, 0.3333333, 0.8571429,
0.8333333, 0.3333333, 0.8000000, 0.8125000, 0.8750000,
1.0000000, 0.2571429, 1.0000000, 0.3714286, 0.6000000,
0.9375000, 0.9583333, 1.0000000, 0.9545455, 0.7619048)
)
my_aov <- aov(Value ~ Genotype * Tissue, TRY2)
TUKEY<- TukeyHSD(my_aov)
generate_label_df <- function(HSD, flev){
Tukey.levels <- HSD[[flev]][,4]
Tukey.labels <- multcompLetters(Tukey.levels)['Letters']
plot.labels <- names(Tukey.labels[['Letters']])
boxplot.df <- TRY2 %>%
group_by(!!sym(flev)) %>%
summarise(Value = max(fivenum(Value)) + 0.2)
plot.levels <- data.frame(var = plot.labels,
labels = Tukey.labels[['Letters']],
stringsAsFactors = FALSE)
labels.df <- merge(boxplot.df, plot.levels, by.x = flev, by.y = "var", sort = FALSE)
return(labels.df)
}
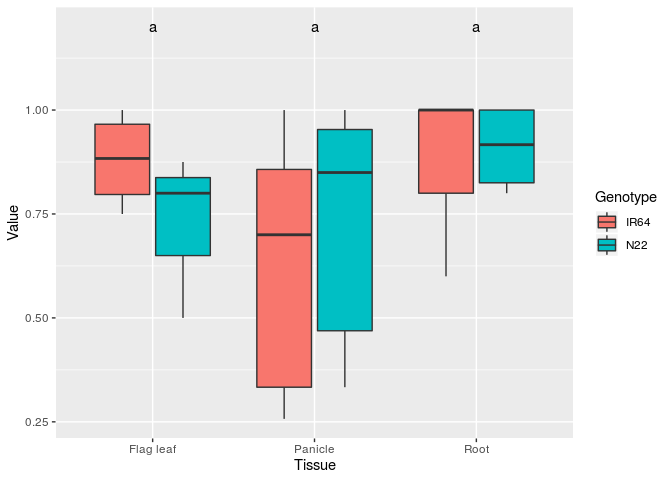
ggplot(TRY2, aes(x=Tissue, y = Value))+
geom_boxplot(aes(fill = Genotype)) +
geom_text(data = generate_label_df(TUKEY,'Tissue'), aes(label = labels))
Created on 2019-11-01 by the reprex package (v0.3.0)