unable to plot with autoplot in forecast from forecast or fable packages

Data is downloaded as below:
prices <- getSymbols(symbols,
src = 'yahoo',
from = "2019-04-12",
auto.assign = TRUE,
warnings = FALSE) %>%
map(~Ad(get(.))) %>%
reduce(merge) %>%

colnames<-(symbols)
Then converted to differenced data:
p <- dailyReturn(prices$SPY, type = "log")
q <- dailyReturn(prices$IWM, type = "log")
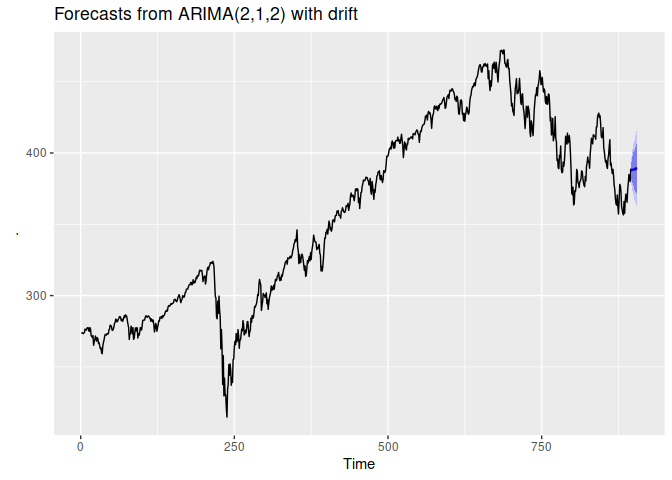
then I am trying to do a simple auto.arima and autoplot forecast:

sp_ts <- as.ts(prices$SPY)
#ts_ts(stk_rtns)
sp_ts %>%
auto.arima()%>%
forecast(h =10)%>%
autoplot()

Error in if (object$spec$constant) { : argument is of length zero

I am unable to solve, there is no solutions on stack overflow, the problem is with the forecast command it presents inverse AR and MA charts which are completey useless.

I can't reproduce your problem. The following works.

library(quantmod)
library(forecast)
library(purrr)

prices <- getSymbols("SPY",
    src = "yahoo",
    from = "2019-04-12",
    auto.assign = TRUE,
    warnings = FALSE
  ) %>%
  map(~ Ad(get(.))) %>%
  reduce(merge)

sp_ts <- as.ts(prices$SPY)

sp_ts %>%
  auto.arima() %>%
  forecast(h = 10) %>%
  autoplot()

Created on 2022-10-29 with reprex v2.0.2

Please create a reproducible example. Using the reprex package can help with this.

Thank you, your code works perfectly. It enables me to finish my work now. I am so grateful. Thank you kindly.
The purr library was missing and there was general sloppy coding. It is not worth doing an autopsy on, just strive to do better.

This topic was automatically closed 21 days after the last reply. New replies are no longer allowed.

If you have a query related to it or one of the replies, start a new topic and refer back with a link.