Which ARIMA Model to use based on the ACF and PACF visuals of my data using fpp3 package

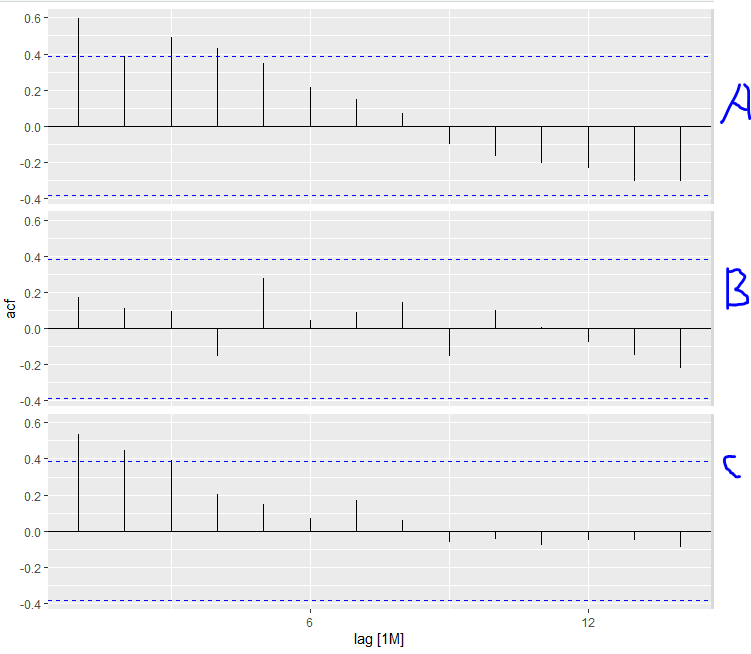
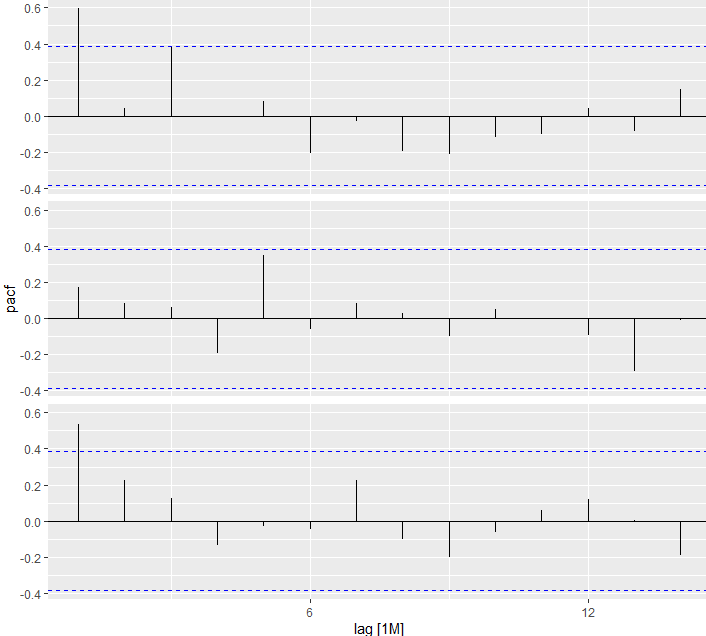
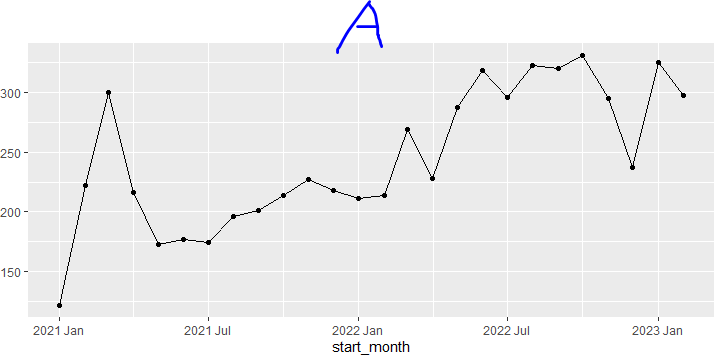
Hello, I am trying to create an arima forecast model using fpp3 package in R. I am trying to use an ARIMA model, it looks like my data has some season component, but hard to tell. Here are the ACF + PACF visuals of the 3 groups - (A, B,C). I am trying to forecast number of clients in each group for the next 1 year and so, I am using the fpp3 package.

So far I have tried the generic ARIMA model and another two I thought would be accurate (arima007 + arima_s) but it wasn't. This is my code:

model <- data_stretch %>%
  model(
    arima = ARIMA(volume),
    arima007 = ARIMA(volume ~ pdq(0,0,7)),
     arima_s = ARIMA(volume ~ pdq(0,0,7)) + PDQ(0,0,0))
  )

Here is what the data looks like for category A when plotted:

if someone could please help me write my code and help me figure out the best pdq and PDQ values based on my ACF and PACF visuals, that would be much appreciated. Thank you

You could also use auto.arima function if you are not sure. There is not enough data to find good arima models here as we dont know if data is stationary, or has constant variance. You can do hegy test for seasonality. If variance changes over time you would need a garch model to model the variance as well...

I ran these tests as well to provide more information, hope this helps too:

> data  %>%
+   features(volume, unitroot_kpss)
# A tibble: 3 × 3
  provider_group          kpss_stat kpss_pvalue
  <chr>                 <dbl>       <dbl>
1 A                     0.774      0.01  
2 B                     0.549      0.0307
3 C                     0.772      0.01  
> data %>%
+   features(volume, unitroot_ndiffs)
# A tibble: 3 × 2
  provider_group          ndiffs
  <chr>              <int>
1  A                     1
2 B                      1
3  C                     1

You need to take one difference for the model to be stationary. But you need hegy test to see if seasonality exists. I recommend studying time series a little.

I did an nsdiffs instead of ndiffs and got this value below, does this mean that my data is seasonal and I need to take 2 difference for the model? I tried to do the hegy method in r using the forecast package but it did not work for me:

> data %>%
+   features(volume, unitroot_nsdiffs)
# A tibble: 3 × 2
  provider_group          nsdiffs
  <chr>               <int>
1 A                       2
2 B                       2
3 C                       2

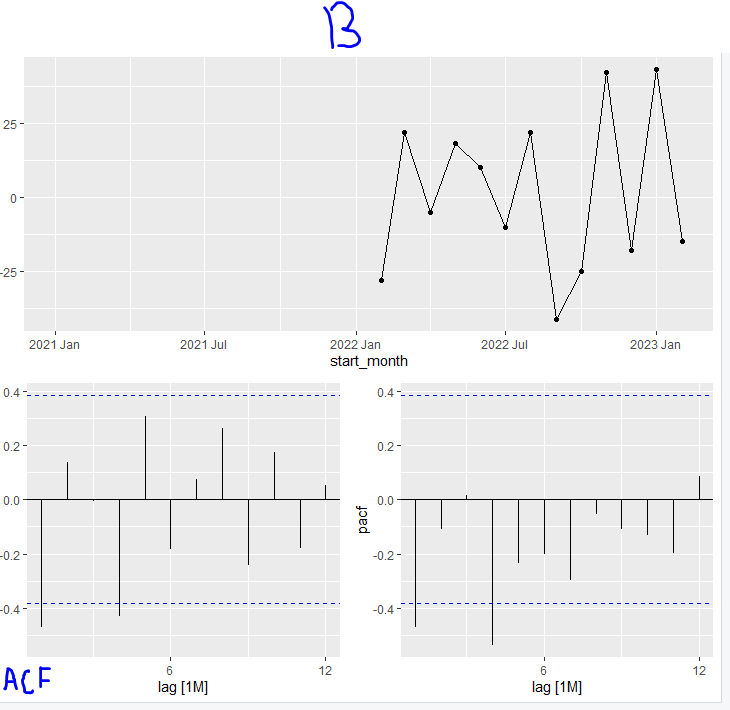
I have also used the following function in provider group B to see if the sesonal component can be determined:

data %>%
  filter(provider_group =="B") %>%
  gg_tsdisplay(difference(volume, 12) %>% difference(), plot_type = "partial", lag = 24) 

and here is what I got:

You have two years of data. Finding out if there is a seasonal component is essentially hopeless, since you only observe a season twice.

agreed, but looking at the data, it does look like there might be a seasonal component, am I right?

This topic was automatically closed 42 days after the last reply. New replies are no longer allowed.

If you have a query related to it or one of the replies, start a new topic and refer back with a link.