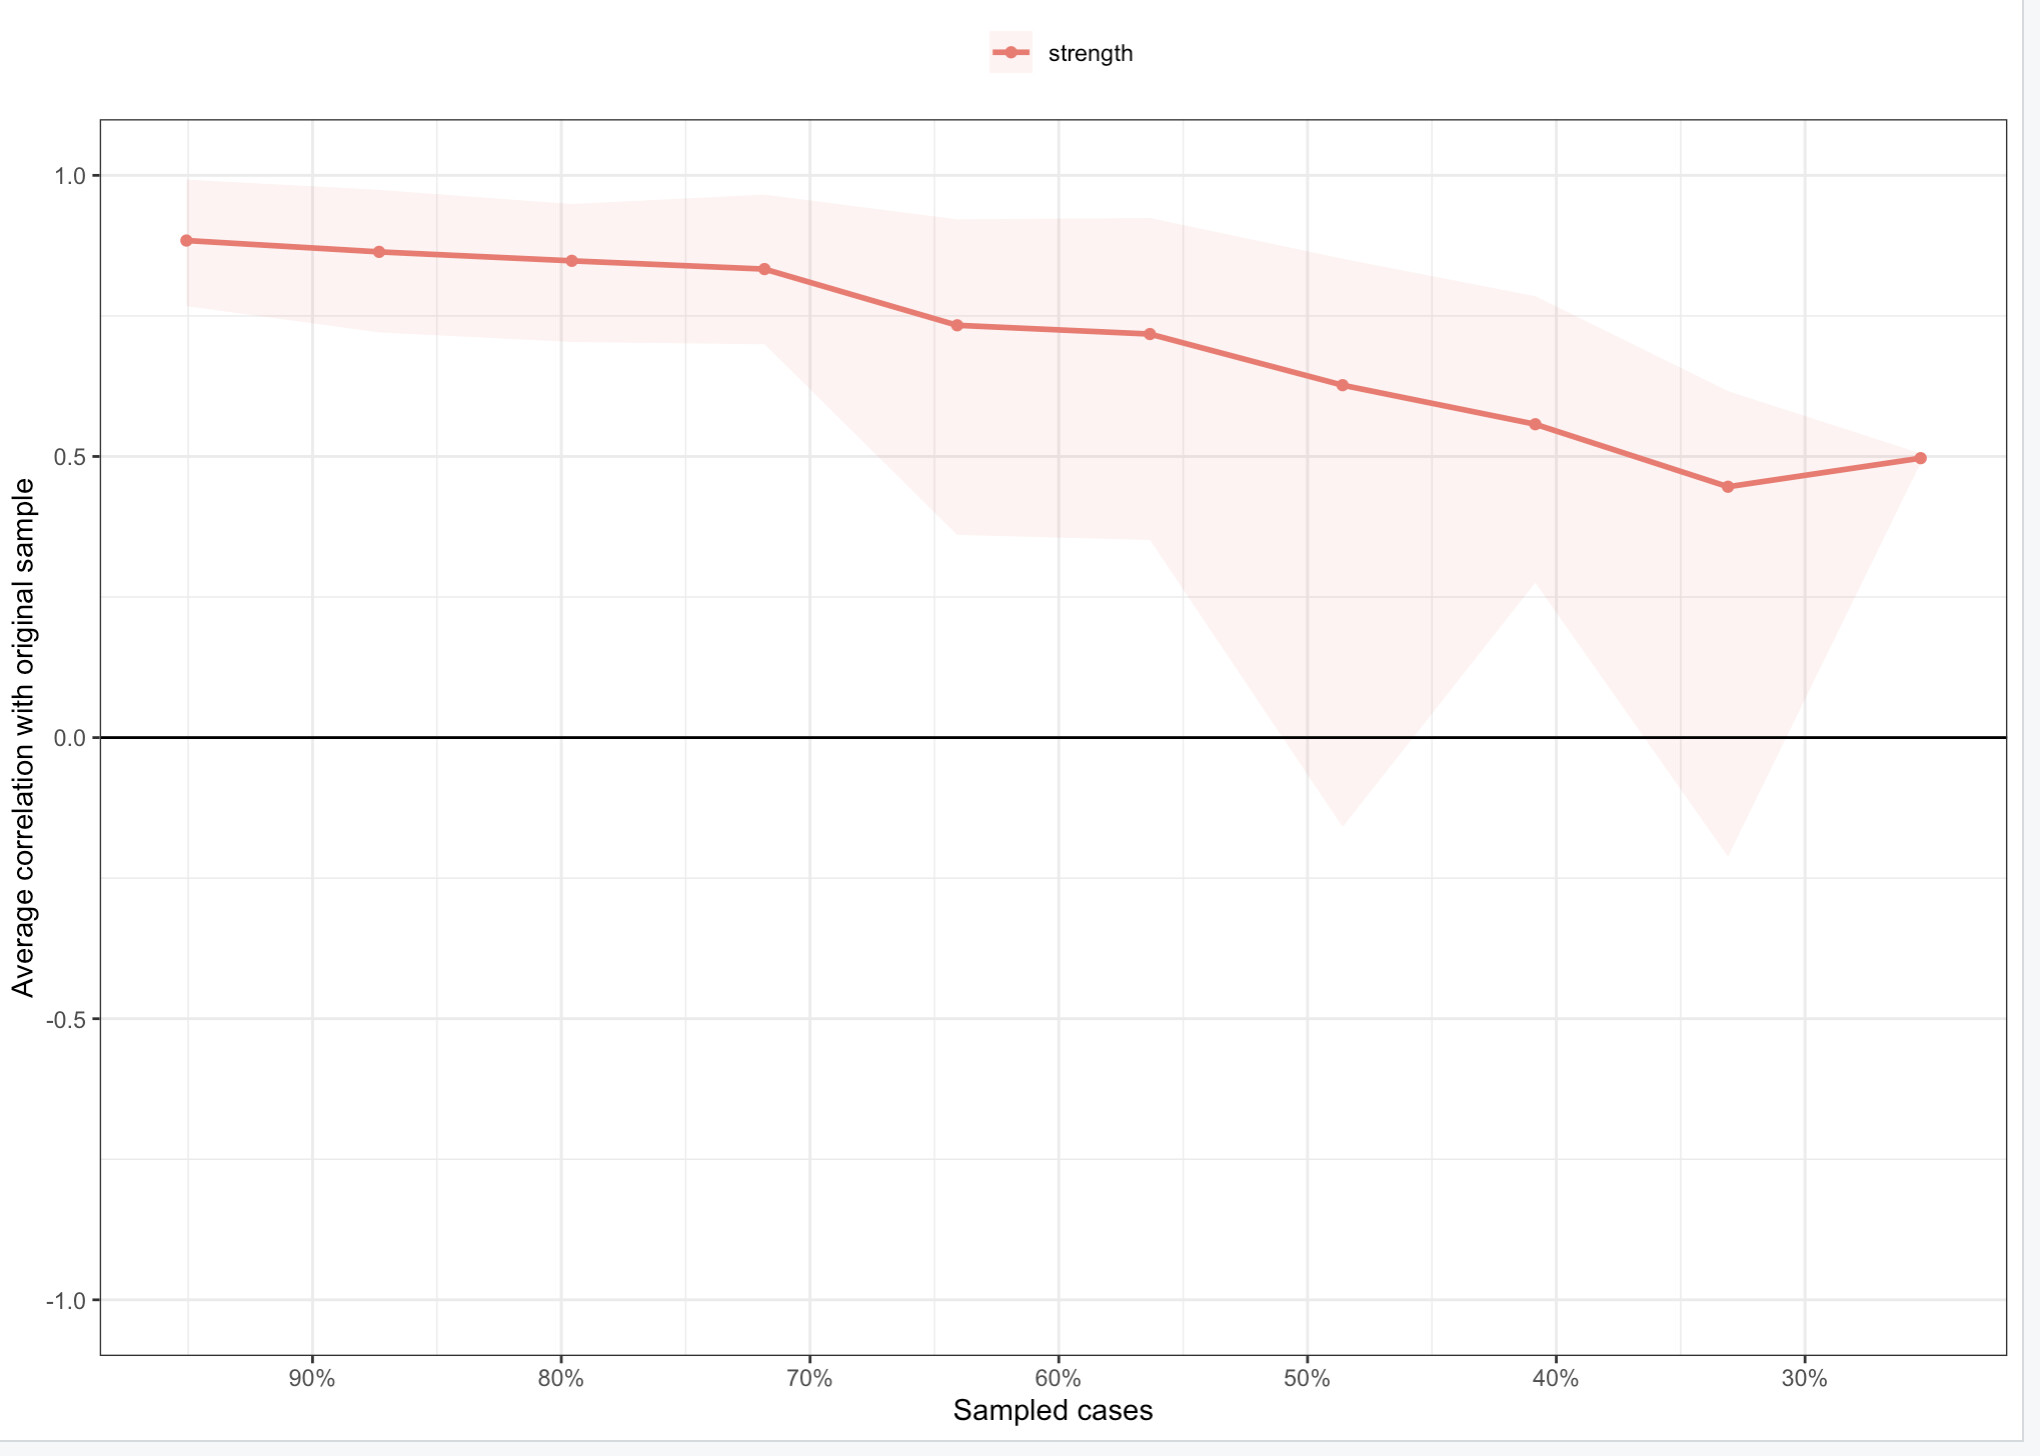
I have just estimated the network accuracy of my network analysis using the nonparametric bootstrap procedure. The next step is computing the stability of the centrality indices, using something like this formula: bootnet(Network, n=Boots=1000, type = "case"). When I go to plot this, only the measure of "Strength" appears, when Betweenness and Closeness should also appear (see the attached graph). I tried using the "include = c("Betweeness", "Closeness", "Strength"), in the formula but still only Strength appears. How can I make all three indices appear on the plot?
Hi, welcome!
We don't really have enough info to help you out. Could you ask this with a minimal REPRoducible EXample (reprex)? A reprex makes it much easier for others to understand your issue and figure out how to help.
If you've never heard of a reprex before, you might want to start by reading this FAQ:
This topic was automatically closed 21 days after the last reply. New replies are no longer allowed.
If you have a query related to it or one of the replies, start a new topic and refer back with a link.