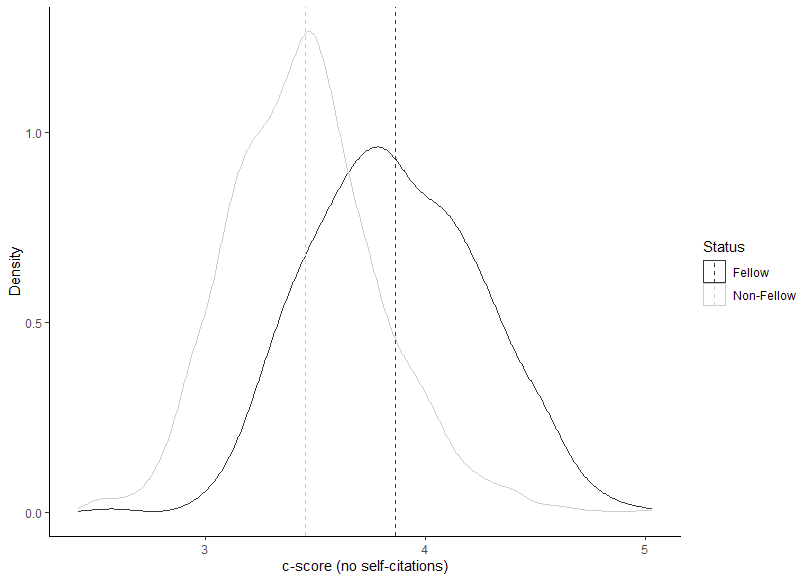
density_plot <- df_aus |>
  ggplot(mapping = aes(x = c_ns, color = Status)) +
  geom_density(alpha = 0.5) +
  theme_bw() +
  labs(x = "c-score (no self-citations)",
       y = "Density") +
  geom_vline(data = means, aes(xintercept = grp_mean, color = Status), linetype = "dashed") +
  scale_color_grey() +
  scale_fill_grey() +
  theme_classic()

print(density_plot)
Add df_aus and means to help understand the issue?
1 Like
I don't see anything mapped to the fill aesthetic. Without that, I don't think scale_fill_grey() will do anything.
2 Likes
thank you/! This was the issue: I changed aes() to include fill = Status and it now works:
density_plot <- df_aus |>
  ggplot(mapping = aes(x = c_ns, color = Status, fill = Status)) +
  geom_density(alpha = 0.1) +
  theme_bw() +
  xlab("\nraw c-score (no self-citations") +
  ylab("Density\n") +
  geom_vline(data = means, aes(xintercept = grp_mean, color = Status), linetype = "dashed") +
  scale_color_grey() +
  scale_fill_grey() +
  theme_classic() +
  scale_x_continuous(breaks=seq(1, 5, 0.2)) +
  scale_y_continuous(breaks=seq(0.0, 2.0, 0.25)) +
  theme(legend.position = c(0.85, 0.85), text = element_text(size = 12))
print(density_plot)
This topic was automatically closed 7 days after the last reply. New replies are no longer allowed.
If you have a query related to it or one of the replies, start a new topic and refer back with a link.