Why Output plots in Rstudio Plot instead of mainPanel in shiny app?

...here I want to plot with the renderDataTable() functions:

 output$map <- DT::renderDataTable({grid_activation1()})

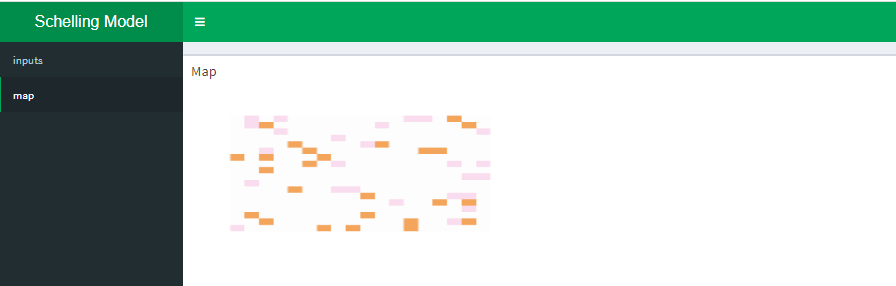
**but nothing is shown in mainPanel of the shiny app.**Of course, after running the program, the matrix is displayed in the plot section of Rstudio, while it is expected to be displayed in the mainPanel section defined in the UI section of my code. I used renderTable() too but again, no change happened. Why did this happen?

and this is my grid_activation1()

server <- function(input, output) {   
    grid_activation1 <- eventReactive(input$Id8 ,{
    group<-c(rep(0,(input$Ic1*input$Ic1)-input$Ic2),rep(1,input$Ic2/2),rep(2,input$Ic2/2))
    grid<-matrix(sample(group,input$Ic1*input$Ic1,replace=F), ncol=input$Ic1)
    
    
    image(grid,col=c("#fdfdfd","#ee7709a9","#f9dcee"),axes=F)
    
    happiness_tracker<-c()
    
    get_neighbors<-function(coords) {
      n<-c()
      for (i in c(1:8)) {
        
        if (i == 1) {
          x<-coords[1] + 1
          y<-coords[2]
        }
        
        if (i == 2) {
          x<-coords[1] + 1
          y<-coords[2] + 1
        }
        
        if (i == 3) {
          x<-coords[1]
          y<-coords[2] + 1
        }
        
        if (i == 4) {
          x<-coords[1] - 1
          y<-coords[2] + 1
        }
        
        if (i == 5) {
          x<-coords[1] - 1
          y<-coords[2]
        }
        
        if (i == 6) {
          x<-coords[1] - 1
          y<-coords[2] - 1
        }
        
        if (i == 7) {
          x<-coords[1]
          y<-coords[2] - 1
        }
        
        if (i == 8) {
          x<-coords[1] + 1
          y<-coords[2] - 1
        }
        
        if (x < 1) {
          x<-input$Ic1
        }
        if (x > input$Ic1) {
          x<-1
        }
        if (y < 1) {
          y<- input$Ic1
        }
        if (y > input$Ic1) {
          y<-1
        }
        n<-rbind(n,c(x,y))
      }
      n
    }
    
    for (t in c(1:input$Ic4)) {
      happy_cells<-c()
      unhappy_cells<-c()  


      for (j in c(1:input$Ic1)) {
        for (k in c(1:input$Ic1)) {
          current<-c(j,k)
          value<-grid[j,k] 
          if (value > 0) {
            like_neighbors<-0
            all_neighbors<-0
            neighbors<-get_neighbors(current)
            for (i in c(1:nrow(neighbors))){
              x<-neighbors[i,1]
              y<-neighbors[i,2]
              if (grid[x,y] > 0) {
                all_neighbors<-all_neighbors + 1
              }
              if (grid[x,y] == value) {
                like_neighbors<-like_neighbors + 1
              }
            }
            if (is.nan(like_neighbors / all_neighbors)==FALSE) {
              if ((like_neighbors / all_neighbors) < input$Ic3 ) {
                unhappy_cells<-rbind(unhappy_cells,c(current[1],current[2]))
              }
              else {
                happy_cells<-rbind(happy_cells,c(current[1],current[2]))
              }
            }
            
            else {
              happy_cells<-rbind(happy_cells,c(current[1],current[2]))
            }
          }
        }
      }
      
      happiness_tracker<-append(happiness_tracker,length(happy_cells)/(length(happy_cells) + length(unhappy_cells)))
      rand<-sample(nrow(unhappy_cells))
      for (i in rand) {
        mover<-unhappy_cells[i,]
        mover_val<-grid[mover[1],mover[2]]
        move_to<-c(sample(1:input$Ic1,1),sample(1:input$Ic1,1))
        move_to_val<-grid[move_to[1],move_to[2]]
        while (move_to_val > 0 ){
          move_to<-c(sample(1:input$Ic1,1),sample(1:input$Ic1,1))
          move_to_val<-grid[move_to[1],move_to[2]]
        }
        grid[mover[1],mover[2]]<-0
        grid[move_to[1],move_to[2]]<-mover_val
      }
      
      image(grid,col=c("#fdfdfd","#ee7709a9","#f9dcee"),axes=F)
      
      
    }

Welcome to the community @Sss9978! I don't see the code for the ui, but I assume you're using DT::dataTableOutput() to match DT::renderDataTable(), correct?

yes.
ui:

ui <- dashboardPage(skin = 'green',
                    dashboardHeader(title = 'Schelling Model'),
                    dashboardSidebar(
                      sidebarMenu(
                        menuItem(tabName = "Inputs", text = "inputs"),
                        menuItem(tabName = "Map", text = "map"))),
                    dashboardBody(
                      tabItems(
                        tabItem(tabName = "Inputs",
                                fluidRow(column(12,
                                                fluidRow(column(8,
                                                                
                                                                box(title = h2("Inputs") ,color = "#df445e", width = 16,
                                                                    sliderInput(inputId = "Ic1",
                                                                                label = "Number of Houses:",
                                                                                min = 8,
                                                                                max = 51,
                                                                                value =8),
                                                                    sliderInput(inputId = "Ic2",
                                                                                label = "Number of Neighbours",
                                                                                min=0,
                                                                                max=2000,
                                                                                step=50,
                                                                                value = 0),
                                                                    sliderInput(inputId = 'Ic3',
                                                                                label = 'alike_preference',
                                                                                min=0,
                                                                                max=1,
                                                                                value=0),
                                                                    
                                                                    sliderInput(inputId = 'Ic4',
                                                                                label = 'time',
                                                                                min=0,
                                                                                max=1000,
                                                                                value=0),
                                                                
                                                                    br(),
                                                                    actionButton(inputId = 'Id8','go',style="color: #fff; background-color: #428fd6; border-color: #2e6da4")
                                                                    
                                                                ),
                                                               
                                                ),
                                                
                                                
                                               )
                                                
                                ))),
                        
                        
                        tabItem(tabName = "Map",
                                
                                fluidRow(
                                  
                                  box(title = "Map", color = "blue", ribbon = FALSE,
                                      title_side = "top left", width = 16,
                                      DT::dataTableOutput('map',
                                                          height = "100vh", 
                                                          width = "100%")
                                      
                                      
                                  ),


                                )))
                    ),
)

It appears the output of grid_activation1() is not a table but an image, as shown by the final line above.

I used renderImage() too, but nothing happened.

I was exploring renderImage() too and finally got it to work. In the example below, the final output of grid_activation1() was changed to only return grid. Then, the image() portion was moved within renderImage(), and the ui was updated to imageOutput() to match. Adjust the width and height to the desired size.

library(shiny)
library(shinydashboard)
library(tidyverse)
library(DT)

ui <- dashboardPage(skin = 'green',
                    dashboardHeader(title = 'Schelling Model'),
                    dashboardSidebar(
                      sidebarMenu(
                        menuItem(tabName = "Inputs", text = "inputs"),
                        menuItem(tabName = "Map", text = "map"))),
                    dashboardBody(
                      tabItems(
                        tabItem(tabName = "Inputs",
                                fluidRow(column(12,
                                                fluidRow(column(8,
                                                                
                                                                box(title = h2("Inputs") ,color = "#df445e", width = 16,
                                                                    sliderInput(inputId = "Ic1",
                                                                                label = "Number of Houses:",
                                                                                min = 8,
                                                                                max = 51,
                                                                                value =8),
                                                                    sliderInput(inputId = "Ic2",
                                                                                label = "Number of Neighbours",
                                                                                min=0,
                                                                                max=2000,
                                                                                step=50,
                                                                                value = 0),
                                                                    sliderInput(inputId = 'Ic3',
                                                                                label = 'alike_preference',
                                                                                min=0,
                                                                                max=1,
                                                                                value=0),
                                                                    
                                                                    sliderInput(inputId = 'Ic4',
                                                                                label = 'time',
                                                                                min=0,
                                                                                max=1000,
                                                                                value=0),
                                                                    
                                                                    br(),
                                                                    actionButton(inputId = 'Id8','go',
                                                                                 style="color: #fff; background-color: #428fd6; border-color: #2e6da4")
                                                                    
                                                                ),
                                                                
                                                ),
                                                
                                                
                                                )
                                                
                                ))),
                        
                        tabItem(tabName = "Map",
                                fluidRow(
                                  box(title = "Map", color = "blue", ribbon = FALSE,
                                      title_side = "top left", width = 16,
                                      imageOutput('map')
                                  ),
                                )))
                      )
                    )

server <- function(input, output) {   
  grid_activation1 <<- eventReactive(input$Id8 ,{
    
    group<-c(rep(0,(input$Ic1*input$Ic1)-input$Ic2),
             rep(1,input$Ic2/2),rep(2,input$Ic2/2)
             )
    grid<-matrix(sample(group,input$Ic1*input$Ic1,replace=F), ncol=input$Ic1)
    
    
    image(grid,col=c("#fdfdfd","#ee7709a9","#f9dcee"),axes=F)
    
    happiness_tracker<-c()
    
    get_neighbors<-function(coords) {
      n<-c()
      for (i in c(1:8)) {
        
        if (i == 1) {
          x<-coords[1] + 1
          y<-coords[2]
        }
        
        if (i == 2) {
          x<-coords[1] + 1
          y<-coords[2] + 1
        }
        
        if (i == 3) {
          x<-coords[1]
          y<-coords[2] + 1
        }
        
        if (i == 4) {
          x<-coords[1] - 1
          y<-coords[2] + 1
        }
        
        if (i == 5) {
          x<-coords[1] - 1
          y<-coords[2]
        }
        
        if (i == 6) {
          x<-coords[1] - 1
          y<-coords[2] - 1
        }
        
        if (i == 7) {
          x<-coords[1]
          y<-coords[2] - 1
        }
        
        if (i == 8) {
          x<-coords[1] + 1
          y<-coords[2] - 1
        }
        
        if (x < 1) {
          x<-input$Ic1
        }
        if (x > input$Ic1) {
          x<-1
        }
        if (y < 1) {
          y<- input$Ic1
        }
        if (y > input$Ic1) {
          y<-1
        }
        n<-rbind(n,c(x,y))
      }
      n
    }
    
    for (t in c(1:input$Ic4)) {
      happy_cells<-c()
      unhappy_cells<-c()  
      
      
      for (j in c(1:input$Ic1)) {
        for (k in c(1:input$Ic1)) {
          current<-c(j,k)
          value<-grid[j,k] 
          if (value > 0) {
            like_neighbors<-0
            all_neighbors<-0
            neighbors<-get_neighbors(current)
            for (i in c(1:nrow(neighbors))){
              x<-neighbors[i,1]
              y<-neighbors[i,2]
              if (grid[x,y] > 0) {
                all_neighbors<-all_neighbors + 1
              }
              if (grid[x,y] == value) {
                like_neighbors<-like_neighbors + 1
              }
            }
            if (is.nan(like_neighbors / all_neighbors)==FALSE) {
              if ((like_neighbors / all_neighbors) < input$Ic3 ) {
                unhappy_cells<-rbind(unhappy_cells,c(current[1],current[2]))
              }
              else {
                happy_cells<-rbind(happy_cells,c(current[1],current[2]))
              }
            }
            
            else {
              happy_cells<-rbind(happy_cells,c(current[1],current[2]))
            }
          }
        }
      }
      
      happiness_tracker<-append(happiness_tracker,length(happy_cells)/(length(happy_cells) + length(unhappy_cells)))
      rand<-sample(nrow(unhappy_cells))
      for (i in rand) {
        mover<-unhappy_cells[i,]
        mover_val<-grid[mover[1],mover[2]]
        move_to<-c(sample(1:input$Ic1,1),sample(1:input$Ic1,1))
        move_to_val<-grid[move_to[1],move_to[2]]
        while (move_to_val > 0 ){
          move_to<-c(sample(1:input$Ic1,1),sample(1:input$Ic1,1))
          move_to_val<-grid[move_to[1],move_to[2]]
        }
        grid[mover[1],mover[2]]<-0
        grid[move_to[1],move_to[2]]<-mover_val
      }
    }
    
    grid
    
  })
  
  output$map <- renderImage({
    outfile = tempfile()
    png(outfile)
    image(grid_activation1(),col=c("#fdfdfd","#ee7709a9","#f9dcee"),axes=F)
    dev.off()
    
    list(src = outfile,
         contentType = 'image/png',
         width = 400,
         height = 200,
         alt = 'This is my image'
         )
    }, deleteFile = TRUE)
}

shinyApp(ui, server)

1 Like

This topic was automatically closed 7 days after the last reply. New replies are no longer allowed.

If you have a query related to it or one of the replies, start a new topic and refer back with a link.