Dear all,
We have conducted a study about an expert consulting. And the main result is calculating the correlation coefficient is Kendall’s Tau. There are 45 experts participated the study and scored the evaluation item (30 items).
However, the Kendall’s Tau is 0.3 and the P<0.001. Why the correlation coefficient of Kendall’s Tau is small but the P value is significant?
Kendall's Tau is the statistical test and the p-value is the probability of observing such a value solely as a result of random variation. The term significant does not mean anything more than that.
Thank you for your great comments, which is clearly explanation for p-value.
I still have a confusion of a problem that is there a standard for the correlation coefficient of Kendall’s Tau.
We know that Kendall's coefficient values can range from 0 to 1. Kendall's coefficients of 0.9 or higher are considered very good.
But a Kendall's coefficient of 0.3 in our study is good or moderate or fair agreement range?
similar to Kappa, Is there a possible interpretation of Kendall's coefficient?
Kappa
Poor agreement = Less than 0.20
Fair agreement = 0.21 to 0.40
Moderate agreement = 0.41 to 0.60
Good agreement = 0.61 to 0.80
Very good agreement = 0.81 to 1.00
It always helps to go back to the basic question: what. What question is it that Kendall's \tau is intended to answer?
This statistic puts a number on the ordinal association of two vectors of equal length in which equal index positions of one and the other are paired, such as movie ratings in terms of thumbs up/down in the one and tomatoes in the other, for example. As you can't directly compare thumbs to apples, it uses comparative rank order.
The value of \tau is in the range -1\dots1 corresponding to total disagreement and total agreement, with the 0 neutral ground as the basis for the null hypothesisH_O indicating independence of the two variables.
Characterizing the relationship between two variables based on \tau's specific value as good, bad, or indifferent depends on some stipulated domain convention if the appearance of motivated reasoning is to be avoided. For example, a dataset as a whole may have lurking parametric collinearity among variables and there may be subject matter learning that some categorical variable pairing can be helpful somehow to shed light based on experience that \tau <= -0.1 tends to tease out how some of the possible continuous variables can be handled.
Other than that, the number is what the number is. Except.
There are further refinements to be made to handle ranking involving having to break ties. \tau_a, \tau_b \ \& \ \tau_c test provide different strategies to deal with these cases.
The standard text for ordinal categorical data is Agresti A. Analysis of ordinal categorical data. John Wiley & Sons; 2010 Apr 19.
Thanks a lot!
" What question is it that Kendall's τ is intended to answer?"
This sentence has inspired my thinking.
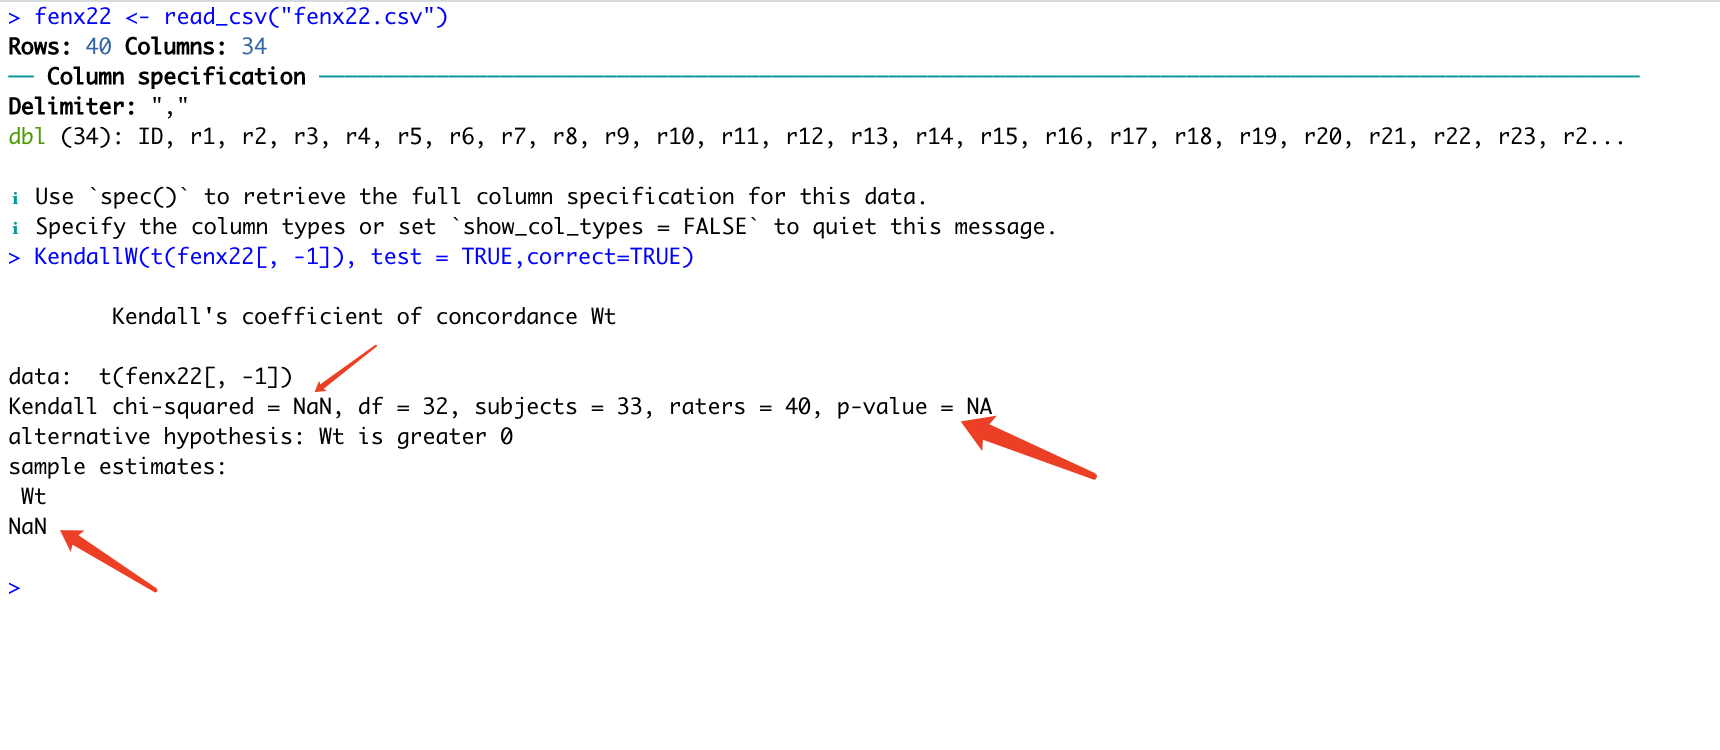
Moreover, we have calculated the kendall w value by R Package ‘DescTools’.
Notably, we try to calculated the kendall w value when all of score are the same value between all of the raters(such as 5).
We found the result is NA.( see the supplment figure).
What does this analysis result mean?
We think if all the raters give a score of 5 for every item, the consistency is very good and the kendall w value is 1.000.
But the NA might tell us that If all the raters give a score of 5 for every item, this analysis have no meaning.
So how do we understand this situation?
A correlation coefficient tells you whether two different series mostly move together or not (to oversimplify). If the series don't move at all, then there isn't a way to answer the question of whether they move together.
Thank you very much!
I think your explanation is concise and to the point.
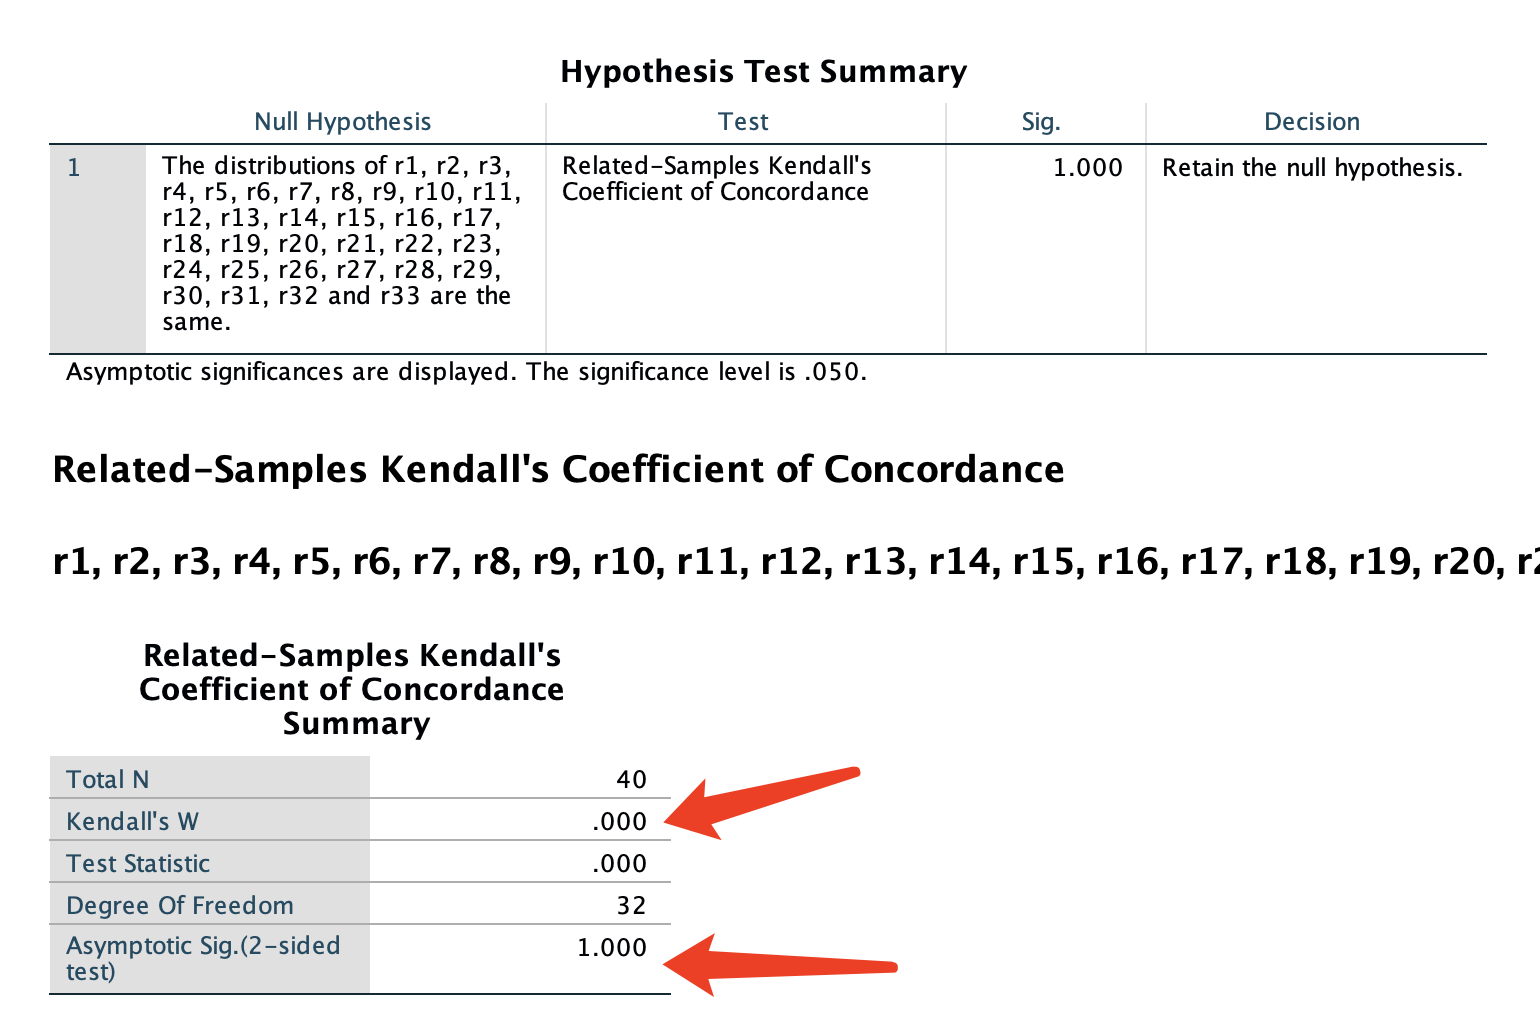
Notably, we also conducted it in SPSS software.
We found the Kendall w value is .000, and the P value is 1.000 and it provide a decision that Retain the null hypothesis.( see the supplment figure).
How do we understand the result of SPSS?
Is it also represnt there isn't a way to answer the question?
The definition of null hypothesis in this article is confusing me.
Did SPSS defines null hypothesis for Kendall W as “The distributions of variables are the same”. ?
If it is true, this definition look completely opposite to the way our defined the null hypothesis “there is no agreement among raters”.
I suppose one could argue that the distributions are the same when all the results are identical. But what does that mean when the results don't really have any distribution?
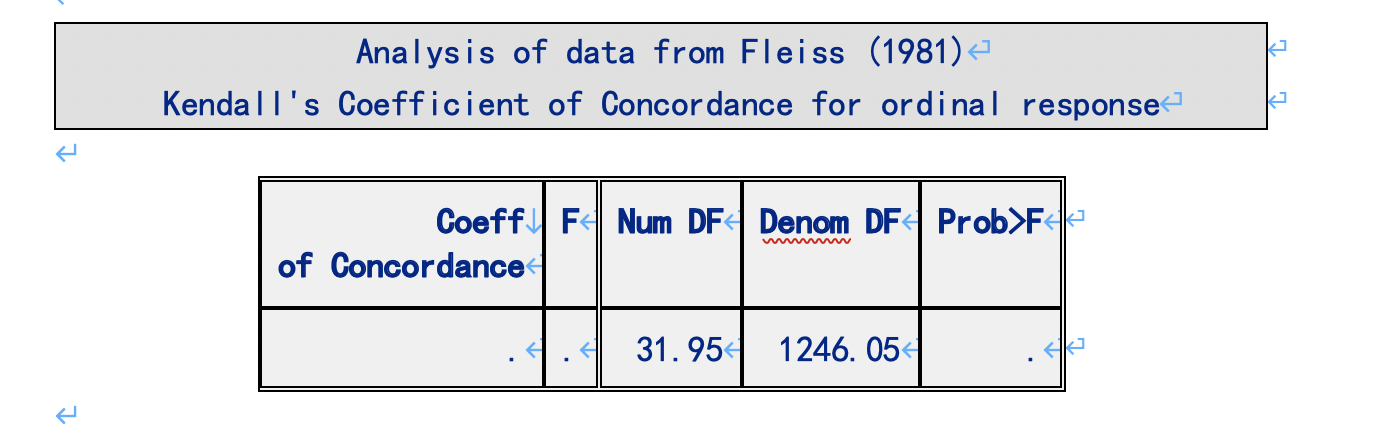
We also conducted the kendall w value by SAS.
The result is consistent with the calculation from R Package ‘DescTools’.
So the definition of null hypothesis for Kendall W is the distributions of variables (items)are the same ?
We suppose that the differences in scores for each item were tested, and the larger the differences in item scores, the better the discrimination ability of the raters.
When the distribution is completely consistent, the system is already in a deterministic state, so there are no inconsistency issues. The premise for good consistency is that the distribution of each entry cannot be completely consistent. Thus, the definition of null hypothesis for Kendall W is the distributions of variables (items)are the same.
Is that so?
But why does the SPSS software provide such results? These results are different from those of R and SAS software.
Is this the difference between Kendall rank correlation coefficient , commonly referred to as Kendall's τ coefficient and Kendall's W (also known as Kendall's coefficient of concordance )?