x-axis date limits on graph not as specified

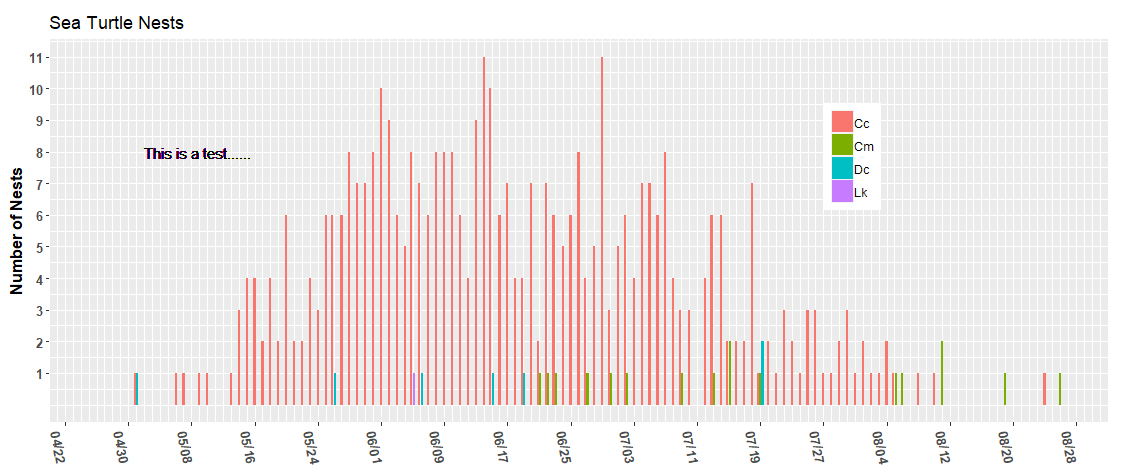
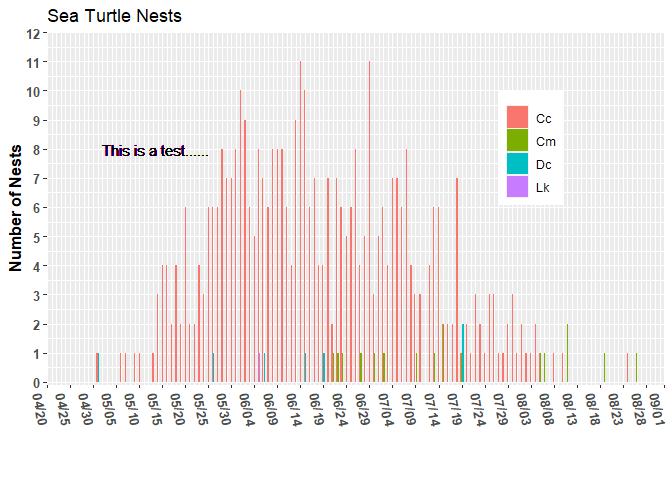
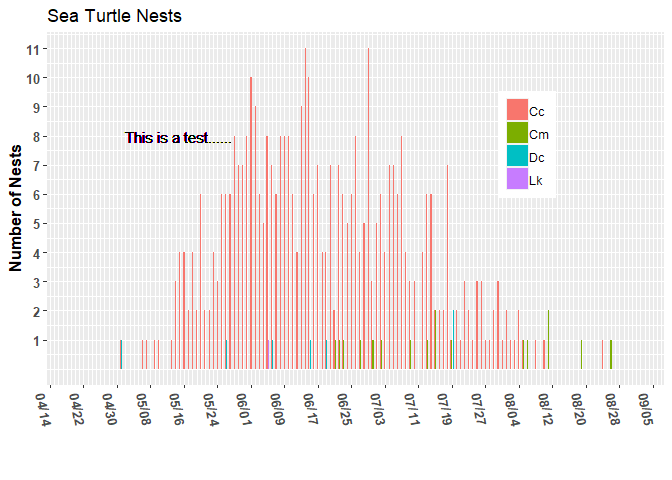
I thought I was getting a decent handle on working with dates. I have set start and end dates as 2022-04-20 and 2022-09-01, respectively. However, the chart appears to have them as 2022-04-13 and 2022-09-08. Not sure why. The text and legend positioning are off a bit too. However, I thought I would deal with that in a separate post once I have the limits working as desired.

library(tidyverse)
library("lubridate")
#> Loading required package: timechange
#> 
#> Attaching package: 'lubridate'
#> The following objects are masked from 'package:base':
#> 
#>     date, intersect, setdiff, union
library("reprex")
 
start_date <- ymd("2022-04-20")
end_date <- ymd("2022-09-01")
position_date <- ymd("2022-07-27") #place on x-axis

date_length <-days(start_date %--% end_date )
position_date_len <- days(start_date %--% position_date)
relative_date <- position_date_len/date_length

start_date
#> [1] "2022-04-20"
end_date
#> [1] "2022-09-01"
position_date
#> [1] "2022-07-27"

date_length
#> [1] "11577600d 0H 0M 0S"
position_date_len
#> [1] "8467200d 0H 0M 0S"
relative_date
#> [1] 0.7313433

turtle_activity_gtm <-  read_csv("https://www.dropbox.com/s/ujdyzqc74152325/turtle_activity_report.csv?dl=1")
#> Rows: 925 Columns: 62
#> ── Column specification ────────────────────────────────────────────────────────
#> Delimiter: ","
#> chr  (22): beach, county, activity, ref_no, activity_comments, encountered?,...
#> dbl  (31): uid, activity_no, nest_no, year, month, week, dayofyear, julianda...
#> lgl   (6): final_treatment, light_management, relocation_reason, lost_nest, ...
#> date  (3): activity_date, emerge_date, inventory_date
#> 
#> ℹ Use `spec()` to retrieve the full column specification for this data.
#> ℹ Specify the column types or set `show_col_types = FALSE` to quiet this message.

ggplot(data = (turtle_activity_gtm |> filter(activity=="N"))) + 
  geom_bar(aes(x = activity_date, fill = species),
           position = position_dodge2(preserve = "single")) +
  scale_y_continuous(breaks = 1:12) +
  scale_x_date(date_breaks = "8 day", 
               date_labels = "%m/%d",
               date_minor_breaks = "1 day",
               limits = c( start_date, end_date))                                 +
    labs(x="",y="Number of Nests", title="Sea Turtle Nests", caption=' ') +
  theme(axis.text.y = element_text(face = "bold",  
                                   size = 10, angle = 0),
        axis.text.x = element_text(face = "bold",  
                                   size = 10, angle = -80),
        legend.position=c(x=relative_date, y=10/12),
        legend.justification = c(0, 1), #upper left
        legend.title = element_blank(),
        legend.spacing.x = unit(0, "mm"),
        legend.spacing.y = unit(0, "mm"),
        axis.title = element_text(size = 12, face = "bold"),
        plot.caption = element_text(size = 15)) +
  geom_text(x=ymd("2022-05-02"), y=8, hjust = "left",label="This is a test......")
#> Warning: Removed 1 rows containing non-finite values (`stat_count()`).

Created on 2023-01-11 with reprex v2.0.2

Thanks,
Jeff

You can add expand = c(0, 0) to scale_x_date().

scale_x_date(date_breaks = "8 day", 
               date_labels = "%m/%d",
               date_minor_breaks = "1 day",
               limits = c(start_date, end_date),
               expand = c(0,0)
               ) +

1 Like

Yes, that works well. It even takes care of the placement of the text and legend along the x-axis.

I do have a follow-up question on the coordinates for expand = c(0,0). What are coordinate types? I tried integers or dates getting only errors.

Thanks,
Jeff

Glad to hear it worked! You should be able to enter integer values into the vector, and they will be applied as either a multiplicative and/or an additive expansion factor(s). Below is a link to further examples and explanations.

https://ggplot2.tidyverse.org/reference/expansion.html

Me again with another follow-up. How come the x-axis labeling starts at 4/22 not 4/20?

I'm not exactly sure why it doesn't start at the minimum limit (or show the max). If you want to force the limits to show, you can replace date_breaks with breaks below. The end date was not picked up in the 8-day sequence, so I added it to the end of the vector.

scale_x_date(breaks = c(seq.Date(as.Date(start_date), as.Date(end_date), by = '8 days'), end_date),
             date_labels = "%m/%d",
             date_minor_breaks = "1 day",
             limits = c(start_date, end_date),
             expand = c(0,0)
             ) +

Thanks again. After this recommendation and some play around on my own, I figured out how to place the legend, particularly relative to the y-axis, where I wanted it. In this case I wanted it at 10. I was always off a bit since there were those spaces above and below the limits.

scale_y_continuous(breaks = 0:12, expand = c(0,0)) +
  expand_limits(y = c(-.1, 12)) +

Here's my complete setup now.

library(tidyverse)
library("lubridate")
#> Loading required package: timechange
#> 
#> Attaching package: 'lubridate'
#> The following objects are masked from 'package:base':
#> 
#>     date, intersect, setdiff, union
library("reprex")
 
start_date <- ymd("2022-04-20")
end_date <- ymd("2022-09-01")
position_date <- ymd("2022-07-27") #place on x-axis

date_length <-days(start_date %--% end_date )
position_date_len <- days(start_date %--% position_date)
relative_date <- position_date_len/date_length
rel_y <- 10/12

start_date
#> [1] "2022-04-20"
end_date
#> [1] "2022-09-01"
position_date
#> [1] "2022-07-27"

date_length
#> [1] "11577600d 0H 0M 0S"
position_date_len
#> [1] "8467200d 0H 0M 0S"
relative_date
#> [1] 0.7313433
rel_y
#> [1] 0.8333333

turtle_activity_gtm <-  read_csv("https://www.dropbox.com/s/ujdyzqc74152325/turtle_activity_report.csv?dl=1")
#> Rows: 925 Columns: 62
#> ── Column specification ────────────────────────────────────────────────────────
#> Delimiter: ","
#> chr  (22): beach, county, activity, ref_no, activity_comments, encountered?,...
#> dbl  (31): uid, activity_no, nest_no, year, month, week, dayofyear, julianda...
#> lgl   (6): final_treatment, light_management, relocation_reason, lost_nest, ...
#> date  (3): activity_date, emerge_date, inventory_date
#> 
#> ℹ Use `spec()` to retrieve the full column specification for this data.
#> ℹ Specify the column types or set `show_col_types = FALSE` to quiet this message.

ggplot(data = (turtle_activity_gtm |> filter(activity=="N"))) + 
  geom_bar(aes(x = activity_date, fill = species),
           na.rm = TRUE,
           position = position_dodge2(preserve = "single")) +
  scale_y_continuous(breaks = 0:12, expand = c(0,0)) +
  expand_limits(y = c(-.1, 12)) +
  scale_x_date(breaks = c(seq.Date((start_date), (end_date), 
                                   by = '5 days'), end_date), 
               date_labels = "%m/%d",
               date_minor_breaks = "1 day",
               limits = c( start_date, end_date),
               expand = c(0,0))   +
  labs(x="",y="Number of Nests", title="Sea Turtle Nests", caption=' ') +
  theme(axis.text.y = element_text(face = "bold",  
                                   size = 10, angle = 0),
        axis.text.x = element_text(face = "bold",  
                                   size = 10, angle = -80),
        legend.position=c(x=relative_date, y=rel_y),
        legend.justification = c(0, 1), #upper left
        legend.title = element_blank(),
        axis.title = element_text(size = 12, face = "bold"),
        plot.caption = element_text(size = 15)) +
  geom_text(x=ymd("2022-05-02"), y=8, hjust = "left",label="This is a test......")

Created on 2023-01-11 with reprex v2.0.2

1 Like

This topic was automatically closed 7 days after the last reply. New replies are no longer allowed.

If you have a query related to it or one of the replies, start a new topic and refer back with a link.