xtable and multicolumn in Shiny

I cannot seem to be able to print a xtable in Shiny that includes both a \multicolumn and \rowcolor. Please see the example below:

library(shiny)
library(xtable)

js <- "
window.MathJax = {
  loader: {load: ['[tex]/colortbl']},
  tex:    {packages: {'[+]': ['colortbl']}}
};
"

ui <- fluidPage(  
  tags$head(
    tags$script(async = "", 
                src   = "https://cdn.jsdelivr.net/npm/mathjax@3/es5/tex-mml-chtml.js"),
    tags$script( HTML(js) )
  ), 
  uiOutput('mytable')
)

server <- function(input, output, session) {
  output$mytable <- renderUI({
    tab              <- data.frame( c(123, 456), c("\\text{abc}", "\\text{def}") )
    colnames(tab)    <- c("A_1", "\\text{Col 2}") 
    
    addtorow         <- list()
    addtorow$pos     <- as.list(c(-1, -1))
    addtorow$command <- as.vector(c("\\multicolumn{2}{l}{Caption}\\\\", "\\rowcolor{#F0DDF7}"), mode = "character")
    
    LaTeXtab <- print(xtable(tab, align = c("c", "c", "l")),
                      floating                   = FALSE,
                      tabular.environment        = "array",
                      sanitize.colnames.function = identity,
                      sanitize.text.function     = identity,
                      include.rownames           = FALSE,
                      add.to.row                 = addtorow
    )
    
    tagList(
      HTML(paste0("$$", LaTeXtab, "$$")),
      tags$script(HTML('MathJax.typeset();'))
    )
  })
}

shinyApp(ui = ui, server = server)

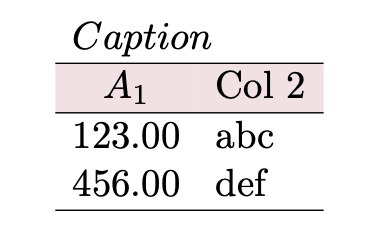
The LaTeX output from xtable is correct (the color hex code does render well in Shiny):

\begin{array}{cl}
  \multicolumn{2}{l}{Caption}\\ \rowcolor{#F0DDF7} \hline
  A_1    & \text{Col 2} \\ \hline
  123.00 & \text{abc}   \\ 
  456.00 & \text{def}   \\ \hline
\end{array}

But the final result is not correct:

multicolumn

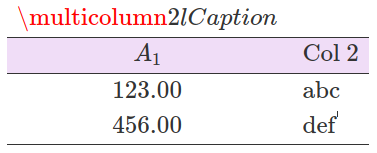
Why is multicolumn not working?
Thank you in advance.

Is there a reason to use xtable? It’s geared to producing pdf output using LaTeX. Since Shiny renders in HTML, one of {gt}, Kable/kableExtra or pander is preferable in decreasing order of ability to fine tune the output.

The reason is purely personal taste, I would like the table to have a LaTeX-ish look.

To get this to work in LaTeX, I have to make changes

\definecolor{pink}{cmyk}{0,.10,0,.03}

$
\begin{array}{cl}
  \multicolumn{2}{l}{Caption}\\ \rowcolor{pink}\hline
  A_1    & \text{Col 2} \\ \hline
  123.00 & \text{abc}   \\ 
  456.00 & \text{def}   \\ \hline
\end{array}
$

Screenshot 2023-05-25 at 1.42.42 AM

Thanks @technocrat.

I mentioned in the OP that the LaTeX code generated by xtable is correct. As you can see, that code matches your code (except for \definecolor, which I do not know how to achieve in shiny).

My problem is that this LaTeX code does not render correctly using shiny and my tagList() command, as you can tell from my screenshot. Do you know what I am missing? I am guessing that I need to change something inside tagList() (the LaTeX code does seem correct after all), but I don't know what.

Thanks once more.

1 Like

Try this, omitting multicolumn

    addtorow$command <- as.vector(c("{Caption}\\\\", "\\rowcolor{#F0DDF7}"), mode = "character")

This worked! I wouldn't have imagined this solution and I use LaTeX for years...
Problem solved, thank you for tagging along!

1 Like

This topic was automatically closed 7 days after the last reply. New replies are no longer allowed.

If you have a query related to it or one of the replies, start a new topic and refer back with a link.