Typically, you use an *apply() function (in base R) or one of the map_*() functions (tidyverse) to automate running the same function over a bunch of different inputs. The specifics of how you might do this depend a lot on how your data are arranged, however. Here's an example of what this might look like, but if your data are organized differently, it may not be directly applicable.
library(tidyverse)

# Create some example data
set.seed(42) # to make the example reproducible
study_data <- data.frame(
  group = factor(c(rep("healthy", 50), rep("patient", 50))),
  responseA = c(rnorm(50, mean = 20, sd = 2), rnorm(50, mean = 22, sd = 3)),
  responseB = c(rnorm(50, mean = 12, sd = 1), rnorm(50, mean = 22, sd = 1)),
  responseC = c(rnorm(50, mean = 2.5, sd = 1), rnorm(50, mean = 3.5, sd = 1)),
  responseD = c(rnorm(50, mean = 18, sd = 2), rnorm(50, mean = 18, sd = 3)),
  responseE = c(rnorm(50, mean = 0.54, sd = 1), rnorm(50, mean = 0.21, sd = 1)),
  responseF = c(rnorm(50, mean = 86.2, sd = 2), rnorm(50, mean = 74.3, sd = 1)),
  responseG = c(rnorm(50, mean = 4, sd = 2), rnorm(50, mean = 8, sd = 3))
)
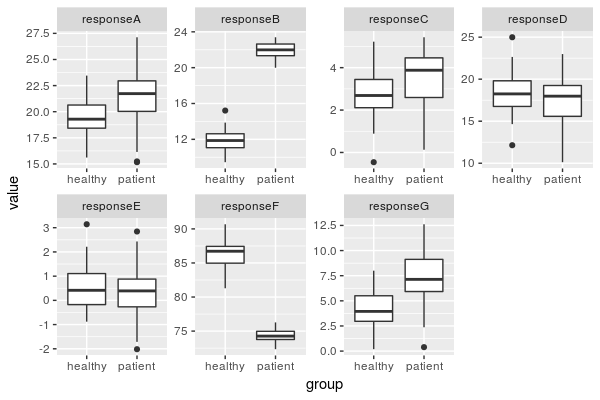
Aren't the results nice when I make up the data? ![]()
# All the t-tests, base R style
t_tests <- lapply(
  study_data[, -1], # apply the function to every variable *other than* the first one (group)
  function(x) { t.test(x ~ group, data = study_data) }
)

# All the t-tests, tidyverse style
t_tests_tidy <- map(
  select(study_data, -group),
  ~ t.test(.x ~ group, data = study_data)
)

# Same basic results, either way
t_tests$responseB
#>
#>  Welch Two Sample t-test
#>
#> data:  x by group
#> t = -55.861, df = 97.783, p-value < 2.2e-16
#> alternative hypothesis: true difference in means is not equal to 0
#> 95 percent confidence interval:
#>  -10.487324  -9.767745
#> sample estimates:
#> mean in group healthy mean in group patient
#>              11.84875              21.97628
t_tests_tidy$responseB
#>
#>  Welch Two Sample t-test
#>
#> data:  .x by group
#> t = -55.861, df = 97.783, p-value < 2.2e-16
#> alternative hypothesis: true difference in means is not equal to 0
#> 95 percent confidence interval:
#>  -10.487324  -9.767745
#> sample estimates:
#> mean in group healthy mean in group patient
#>              11.84875              21.97628

# Pull out specific test stats, etc.
t_tests$responseB$statistic
#>         t
#> -55.86131
Created on 2018-08-24 by the reprex package (v0.2.0).
If this doesn't apply directly to how your data are organized, it will help a lot if you can do as @tbradley suggests and post a reproducible example with sample data and code.
Edited to add: Since this was fake data and about looping, I didn't do any sort of adjustment for all these comparisons I'm making. Anybody reading this in the future: please think hard about your choice of alpha (and maybe the suitability of this specific — or general — approach) before you merrily run umpty-million t-tests.