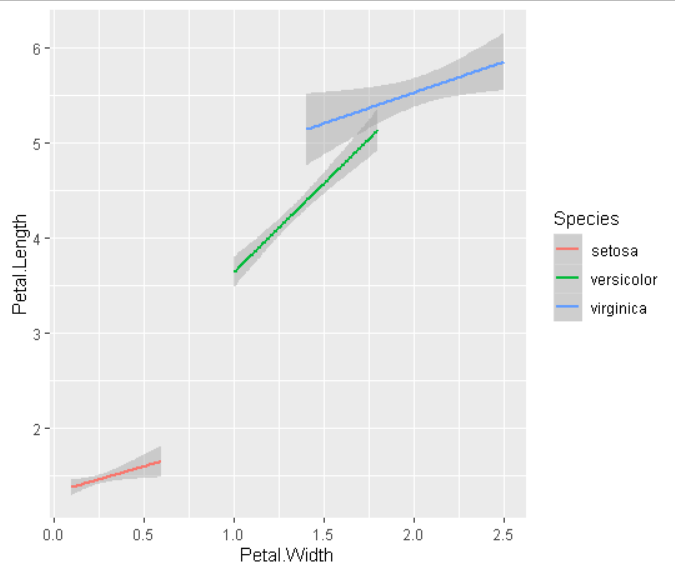
example of linear model over 3 sets of species in iris data
library(ggplot2)

ggplot(data= iris ,
       mapping = aes(x = Petal.Width,
                     y = Petal.Length,
                     color=Species)) +
  geom_smooth(method='lm', formula= y~x)
Edited::as replied to wrong post.