Thank you @nwerth. I want to maintain some separation between the groups - my actual data is considerably more dense than the example. Adding scale_x_discrete(expand=expand_scale(add=1)) does the trick!
library(ggplot2)
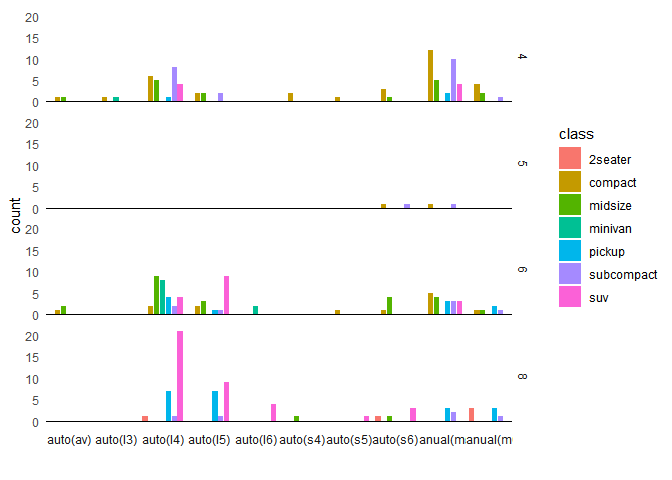
ggplot(mpg, aes(class, fill=class)) +
geom_hline(yintercept=0) +
geom_bar() +
facet_grid(cyl~trans, switch='x') +
theme_minimal() +
theme(axis.ticks=element_blank(),
axis.text.x=element_blank(),
panel.spacing.x = unit(0, "null"),
panel.grid=element_blank()) +
labs(x='') +
scale_x_discrete(expand=expand_scale(add=1))
Created on 2018-10-05 by the reprex package (v0.2.0).