Authors:
For a couple of decades, we have been loyal users of the Hmisc package in general, and the Hmisc::describe function in particular, as a way to explore data before any analyses. As is often the case in the R ecosystem, there are numerous ways to accomplish this task (see summarizing data blog posts here and here for a dated yet extensive review). Our appreciation for Hmisc::describe originated from its concise look (pre-rmarkdown days implementing Sweave/Latex/PDF) and its ability to link with SAS formatted datasets (containing labels, formats, special missing). Indeed, in the clinical research industry, SAS formatted datasets (SAS transport .xpt or native .sas7bdat files) remain widely used while the R language continues to grow in popularity. Dr. Frank Harrell, who developed the Hmisc package, has been, from our perspective, a luminary as he lays out the possibilities embedded in the R language, particularly in the clinical research environment.
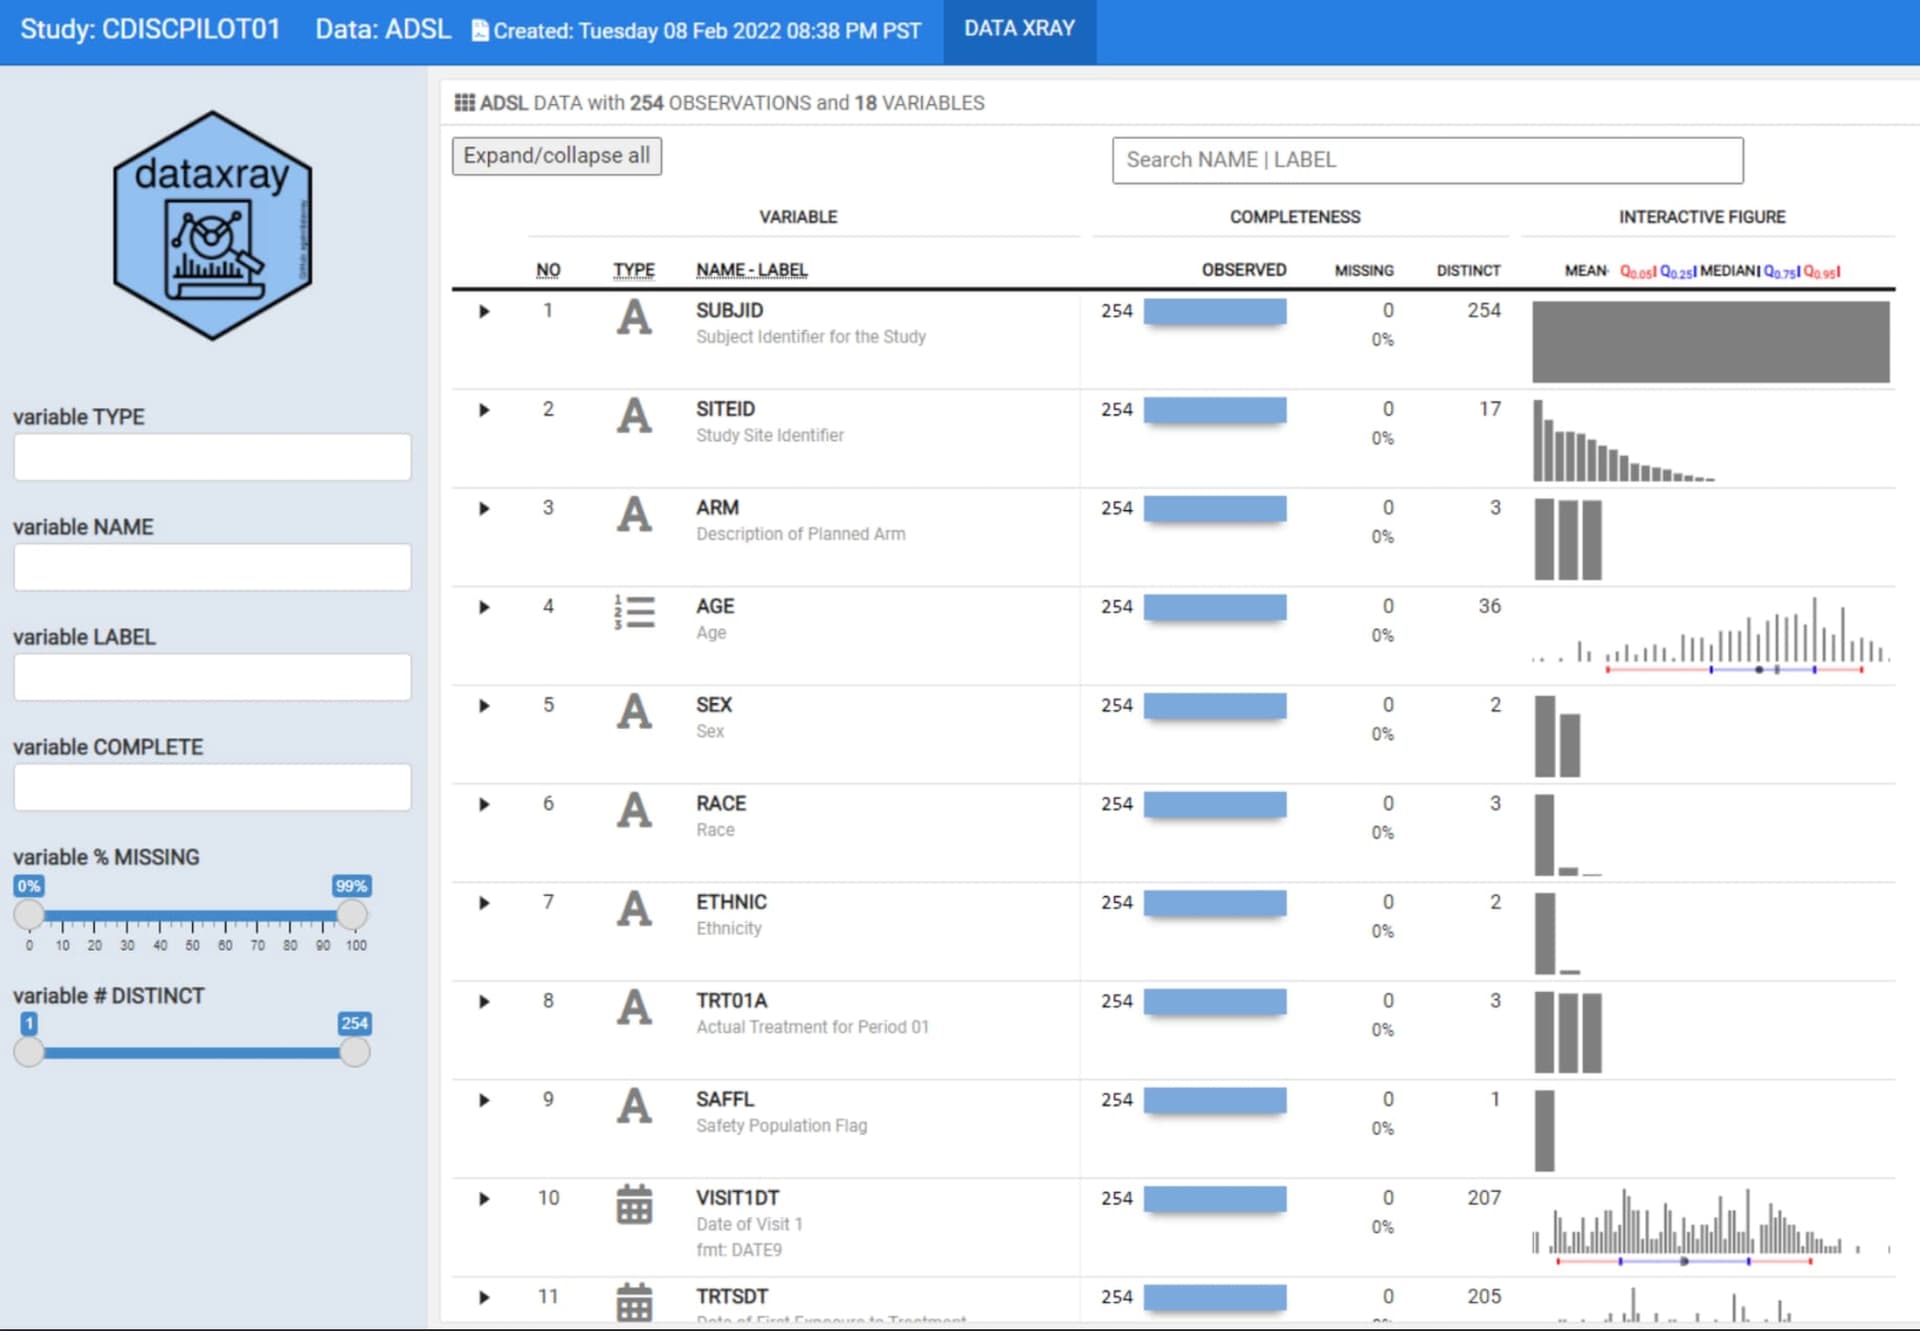
For some time now, we have wanted to reengineer the aforementioned describe function to provide a modern and interactive interface to the static (HTML and/or PDF) report. The datadigest package was an effort to build an interactive data explorer inspired by Hmisc::describe; the package leveraged JavaScript for interactivity, with htmlwidget and Shiny interfaces for use in R. Since the release of datadigest, the R community has continued to deliver increasingly powerful frameworks for interactive displays. Therefore, we took the 2021 RStudio Table Contest as an opportunity to accomplish the goal of building an interactive interface for describe using tools available in R. We have utilized the power of reactable embedded with plotly interactive figures within a flexdashboard to generate concise summaries of every variable in a dataset with minimal user configuration. In order for other users to readily deploy such a powerful summary table, we wrapped our work into the {** dataxray**} package.
For this challenge, we selected a CDISC (Clinical Data Interchange Standards Consortium) ADaM (Analysis Data Model) ADSL (Analysis Data Subject Level) dataset as an illustration. The ADSL dataset structure is one record per subject and contains variables such as subject-level population flags, planned and actual treatment variables, demographic information, randomization factors, subgrouping variables, and important dates originated from the PHUSE CDISC Pilot replication study.