Actually, in taking screenshots to write that previous answer, I think I was incorrect above. It appears that everything besides the fill scale values is based off of the most recent set of outcome_of_interest, indep_of_interest, and var_of_interest. It was hard to see initially because of how I organized the entire Rmarkdown, but (expanding on the above reprex) it's clear that all of these variables are altered to the most recent assignment in the plot_grid() version.
library(tidyverse)
library(cowplot)
# define a function to make plots:
gg_lm_simple <- function(.data = ., .y, .x, .var = NULL, .se = FALSE, ...) {
ggplot(.data, aes(x = {{.x}}, y = {{.y}})) +
geom_jitter(aes(fill = {{.var}}), shape = 21, na.rm = TRUE, alpha = 0.7, size = 2, ...) +
geom_smooth(method = "lm", formula = "y ~ x", se = {{.se}}, color = "black", size = 1) +
scale_fill_distiller(type = "div", palette = "RdBu",
aesthetics = c("fill", "color"), direction = 1,
limits = c(-1,1)*max(abs({{.var}}))) + #to keep center at 0, which is necessary for my data
theme_minimal() +
labs(title = bquote(Delta ~ .(outcome_oi_name) ~ "~" ~ Delta ~ .(var_oi_name)),
y = bquote(Delta ~ .(outcome_oi_name) ~ .(outcome_oi_unit)),
x = bquote(Delta ~ .(indep_oi_name) ~ .(indep_oi_unit)),
fill = bquote(Delta ~ .(var_oi_name) ~ .(var_oi_unit)))
}
df <- mtcars %>%
mutate(wt = (wt-3.2)*4) %>% #to approximate data that is both positive and negative
mutate(qsec = qsec-18) #to approximate data that is both positive and negative, smaller scale than qsec
##############################################
#And then this part I copy and paste, updating the variables as needed:
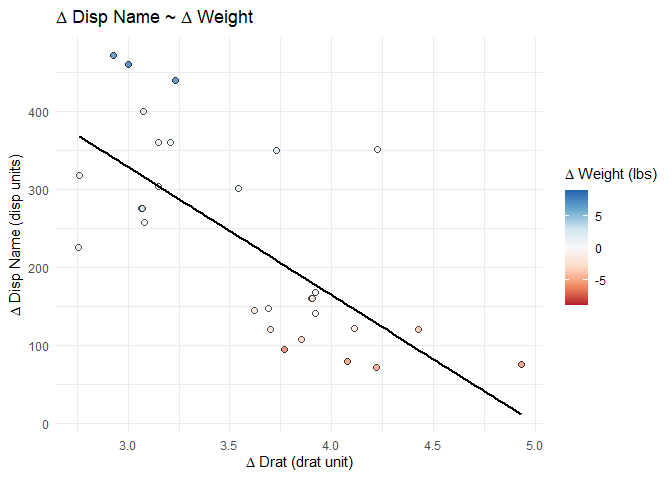
##FIRST PLOT: disp ~ drat + wt
# define which of my variables I want to use
outcome_of_interest <- df$disp
outcome_oi_name <- "Disp Name"
outcome_oi_unit <- "(disp units)"
outcome_oi_vlabel <- "disp"
indep_of_interest <- df$drat
indep_oi_name <- "Drat"
indep_oi_unit <- "(drat unit)"
indep_oi_vlabel <- "drat"
var_of_interest <- df$wt
var_oi_name <- "Weight"
var_oi_unit <- "(lbs)"
var_oi_vlabel <- "wt"
splot_out_in_var <- df %>%
gg_lm_simple(outcome_of_interest, indep_of_interest, var_of_interest)
# display the plot at this point in the .Rmd
splot_out_in_var
# save the plot with the specific variable names to use later
assign(glue::glue("splot_{outcome_oi_vlabel}_{indep_oi_vlabel}_{var_oi_vlabel}"), splot_out_in_var)
# so splot_out_in_var would also be assigned to splot_disp_drat_wt
# plus some other code/analysis here, which is not relevent to the question
###############################################
# new variable defined, code is copy/pasted and updated
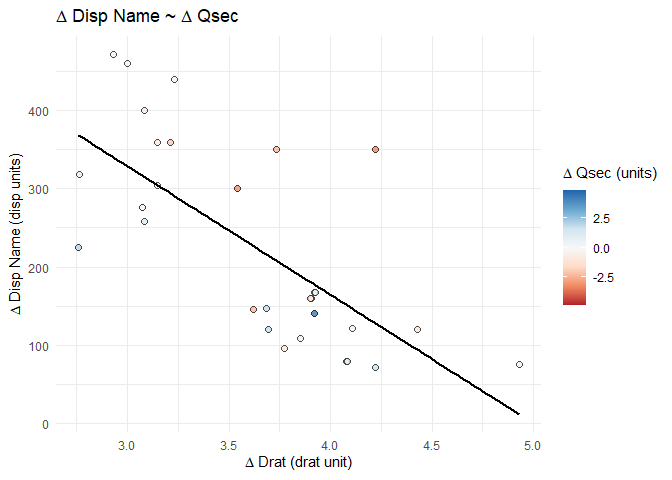
##SECOND PLOT: disp ~ drat + qsec
# define which of my variables I want to use
outcome_of_interest <- df$disp
outcome_oi_name <- "Disp Name"
outcome_oi_unit <- "(disp units)"
outcome_oi_vlabel <- "disp"
indep_of_interest <- df$drat
indep_oi_name <- "Drat"
indep_oi_unit <- "(drat unit)"
indep_oi_vlabel <- "drat"
var_of_interest <- df$qsec
var_oi_name <- "Qsec"
var_oi_unit <- "(units)"
var_oi_vlabel <- "qsec"
splot_out_in_var <- df %>%
gg_lm_simple(outcome_of_interest, indep_of_interest, var_of_interest)
# display the plot at this point in the .Rmd
splot_out_in_var
# save the plot with the specific variable names to use later
assign(glue::glue("splot_{outcome_oi_vlabel}_{indep_oi_vlabel}_{var_oi_vlabel}"), splot_out_in_var)
## so splot_out_in_var would also be assigned to splot_disp_drat_qsec
##############################################
#And then this part I copy and paste, updating the variables as needed:
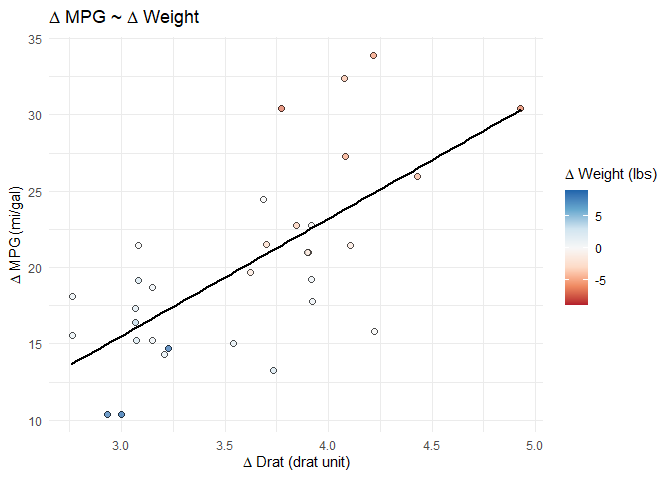
##THIRD PLOT: mpg ~ drat + wt
# define which of my variables I want to use
outcome_of_interest <- df$mpg
outcome_oi_name <- "MPG"
outcome_oi_unit <- "(mi/gal)"
outcome_oi_vlabel <- "mpg"
indep_of_interest <- df$drat
indep_oi_name <- "Drat"
indep_oi_unit <- "(drat unit)"
indep_oi_vlabel <- "drat"
var_of_interest <- df$wt
var_oi_name <- "Weight"
var_oi_unit <- "(lbs)"
var_oi_vlabel <- "wt"
splot_out_in_var <- df %>%
gg_lm_simple(outcome_of_interest, indep_of_interest, var_of_interest)
# display the plot at this point in the .Rmd
splot_out_in_var
# save the plot with the specific variable names to use later
assign(glue::glue("splot_{outcome_oi_vlabel}_{indep_oi_vlabel}_{var_oi_vlabel}"), splot_out_in_var)
# so splot_out_in_var would also be assigned to splot_mpg_drat_wt
# plus some other code/analysis here, which is not relevent to the question
###############################################
# new variable defined, code is copy/pasted and updated
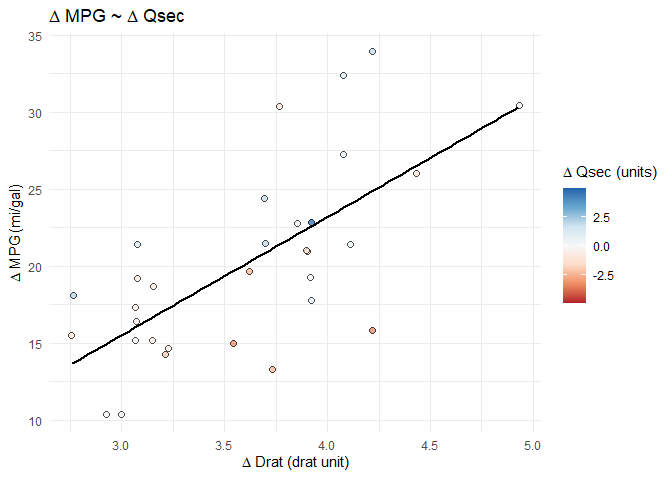
##FOURTH PLOT: mpg ~ drat + qsec
outcome_of_interest <- df$mpg
outcome_oi_name <- "MPG"
outcome_oi_unit <- "(mi/gal)"
outcome_oi_vlabel <- "mpg"
indep_of_interest <- df$drat
indep_oi_name <- "Drat"
indep_oi_unit <- "(drat unit)"
indep_oi_vlabel <- "drat"
var_of_interest <- df$qsec
var_oi_name <- "Qsec"
var_oi_unit <- "(units)"
var_oi_vlabel <- "qsec"
splot_out_in_var <- df %>%
gg_lm_simple(outcome_of_interest, indep_of_interest, var_of_interest)
# display the plot at this point in the .Rmd
splot_out_in_var
# save the plot with the specific variable names to use later
assign(glue::glue("splot_{outcome_oi_vlabel}_{indep_oi_vlabel}_{var_oi_vlabel}"), splot_out_in_var)
## so splot_out_in_var would also be assigned to splot_disp_drat_qsec
#################################################
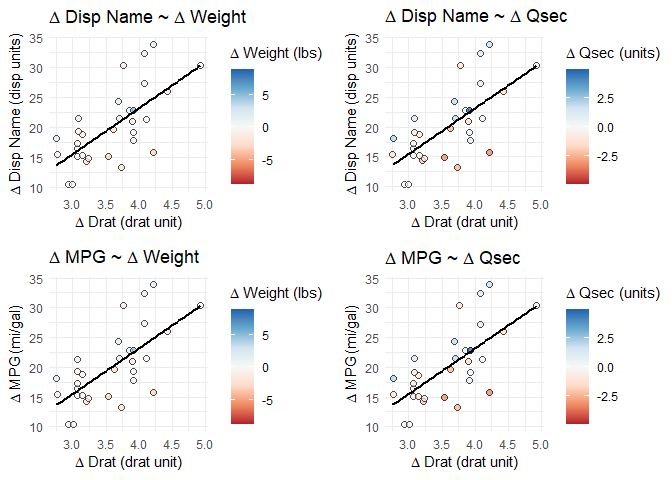
#At the end of the Rmd, I want to compare these plots together using cowplot::plot_grid.
# Here I have specifically typed out all 48 names, I'm not using any sort of function to get the names
splot_list <- list(splot_disp_drat_wt, splot_disp_drat_qsec,
splot_mpg_drat_wt, splot_mpg_drat_qsec)
# and make the plot:
cowplot::plot_grid(plotlist = splot_list, align = "hv", nrow = 2)
Created on 2021-03-11 by the reprex package (v1.0.0)
So even though the graph labels remain as they should, all four plots are clearly plotting mpg as the y axis since the top two graphs should have negative slopes.