Hi @Katherine23 , and welcome!
Judging from the error messages, it looks like there's a step to install the necessary fonts to use theme_ipsum_ps. See import_plex_sans() from the theme_ipsum_ps help page
(?hrbrthemes::theme_ipsum_ps ).
The fonts from hbrthemes after running the function import_plex_sans() are located in [~/Library/R/4.1/library/hrbrthemes/fonts/plex-sans], or similar depending on your computer OS. You will also probably have to copy the font to your system or user level font directory.
library("dplyr")
#>
#> Attaching package: 'dplyr'
#> The following objects are masked from 'package:stats':
#>
#> filter, lag
#> The following objects are masked from 'package:base':
#>
#> intersect, setdiff, setequal, union
library("ggplot2")
library("hrbrthemes")
#> NOTE: Either Arial Narrow or Roboto Condensed fonts are required to use these themes.
#> Please use hrbrthemes::import_roboto_condensed() to install Roboto Condensed and
#> if Arial Narrow is not on your system, please see https://bit.ly/arialnarrow
options(hrbrthemes.loadfonts = TRUE)
supersonic <- structure(list(id = 1:6, business = c(NA, 0L, 1L, 1L, NA, NA),
channel = c("Twitter", "Twitter", "Twitter", "Instagram",
"Twitter", "Instagram"), region = c(1L, 3L, 4L, 2L, 2L, 1L
), age_demo = c(4L, 3L, 3L, 3L, 3L, 2L), gender = c("Male",
"Female", "Female", "Female", "Male", "Female"), hhi = c(NA,
NA, NA, NA, NA, 3L), profit = c(343.0659, 318.1855, 316.6524,
276.4889, 371.0668, 249.117)), class = "data.frame", row.names = c(NA,
-6L))
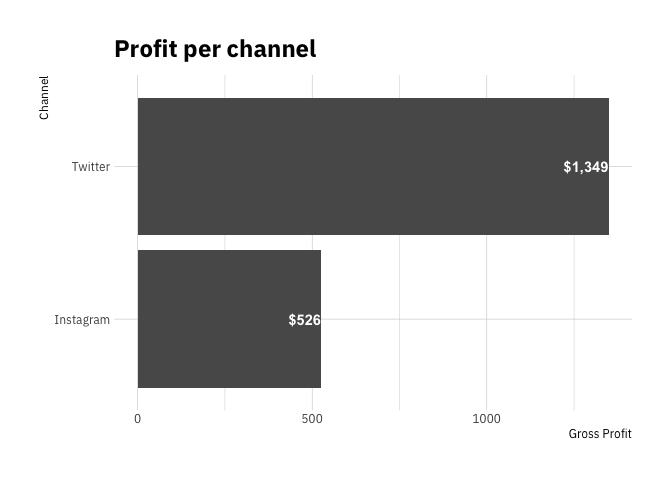
supersonic %>%
group_by(channel) %>%
summarise(gross_profit = sum(profit)) %>%
ggplot(aes(x=gross_profit, y = reorder(channel, gross_profit))) +
geom_bar(stat = "identity") +
geom_text(aes(label = scales::dollar(gross_profit, accuracy = 1)),
hjust = 1, color = "white", fontface = "bold") +
theme_ipsum_ps() +
labs(x="Gross Profit", y="Channel", title = "Profit per channel")
Created on 2021-09-29 by the reprex package (v2.0.1)