library(plotly)
x <- y <- 0:100
z <- outer(X = x, Y = y, function(x, y) 2*x + 3*y)
# sum <- outer(X = x, Y = y, function(x, y) x + y)
# product <- outer(X = x, Y = y, function(x, y) x * y)
# difference <- outer(X = x, Y = y, function(x, y) x - y)
txt <- as.character(outer(X = x, Y = y, function(x, y)
glue::glue("sum is {x+y}<br>product is {x*y}<br>difference is {x-y}")))
plot_ly(
type = "contour",
x = x,
y = y,
z = z,
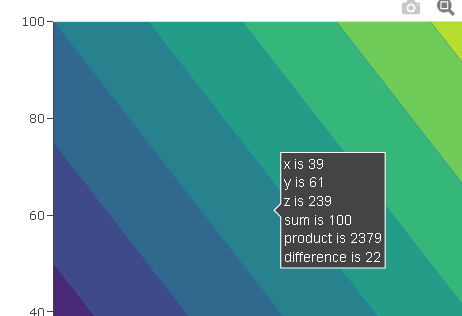
text = txt,
hovertemplate = "x is %{x}<br>y is %{y}<br>z is %{z}<br>%{text}<extra></extra>"
)