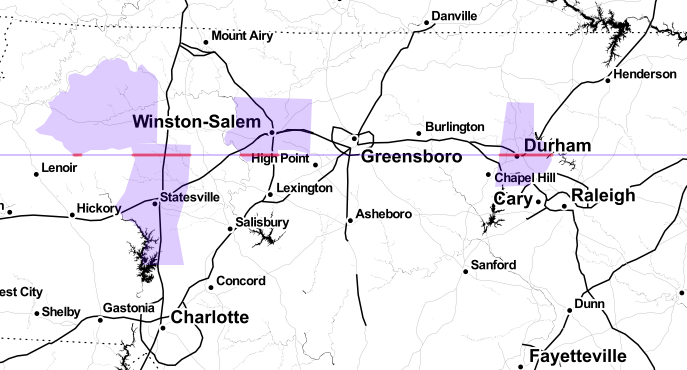
Your example is not exactly reproducible, as @pieterjanvc mentioned, so allow me to continue with an example using the North Carolina shapefile that ships with {sf} package.
What you want is to calculate the intersection of your line and squares separately, using the st_intersection function from {sf} package.
This way you will have two lines object - the original line, and the cross section of the original line and your polygons (in your case squares, in mine some semi random NC counties).
Just make sure you plot the polyline of intersections after the original line.
library(sf)
library(dplyr)
library(leaflet)

# included with sf package
shape <- st_read(system.file("shape/nc.shp", package="sf"))

# some semi-random counties
shape <- shape %>%
  filter(NAME %in% c("Wilkes", "Forsyth", "Durham", "Iredell")) %>%
  st_transform(4326)

# a slice of the 36th parallel
parallel36 <- st_linestring(matrix(c(-84, 36, -75, 36),
                                   nrow = 2, byrow = T),
                            dim = "XY") %>%
  st_sfc(crs = 4326)

# this is the key line, the rest is just chaff...
xsection <- st_intersection(parallel36, shape)

leaflet() %>%
  addProviderTiles(providers$Stamen.Toner) %>%
  addPolygons(data = shape, stroke = NA,
              label = ~NAME) %>%
  addPolylines(data = parallel36, # first the whole line
               weight = 1) %>%
  addPolylines(data = xsection, # then the intersection
               color = "red",
               weight = 3)
