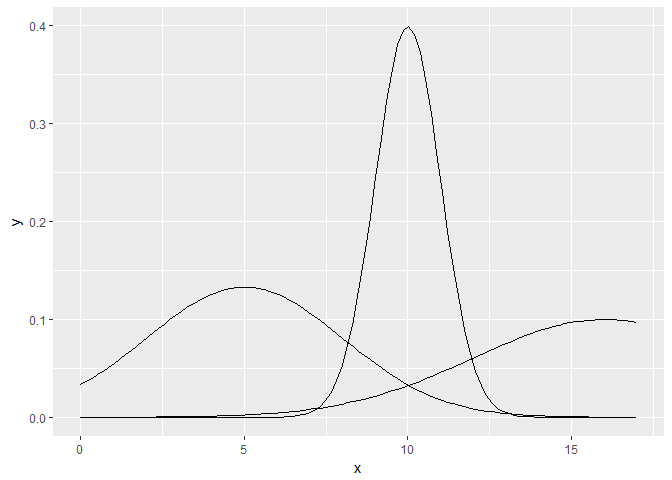
The reduce2 method I used here works reasonably well:
suppressPackageStartupMessages(library(tidyverse))

norm_curves <- tribble(
  ~Mean, ~SD,
  5, 3,
  10, 1,
  16, 4
)

reduce2(.x = norm_curves$Mean,
        .y = norm_curves$SD,
        .init = ggplot(data = tibble(x = 0:17), aes(x)),
        function(prev, .x, .y) {
          prev + stat_function(fun = dnorm,
                               args = list(mean = .x,
                                           sd = .y))
        })
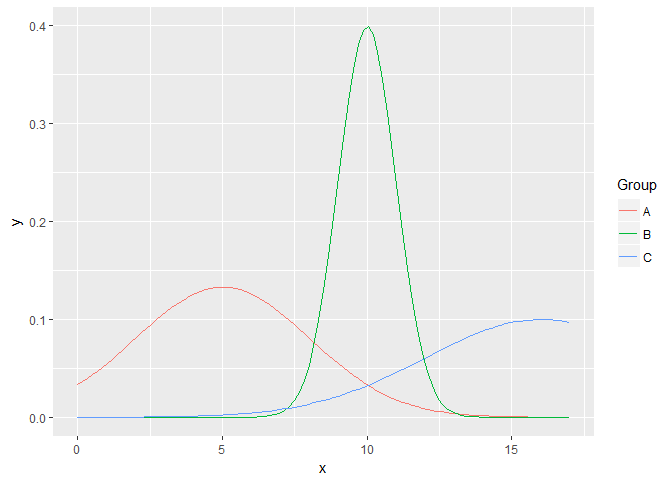
Edit: Oh, and because it was bugging me that color was potentially problematic with reduce2:
suppressPackageStartupMessages(library(tidyverse))

norm_curves <- tribble(
  ~Group, ~Mean, ~SD,
  "A", 5, 3,
  "B", 10, 1,
  "C", 16, 4
)

pmap(norm_curves,
     function(Group, Mean, SD) {
       stat_function(data = . %>% mutate(Group = Group),
                     aes(color = Group),
                     fun = dnorm,
                     args = list(mean = Mean,
                                 sd = SD))
     }) %>%
  reduce(.init = ggplot(data = tibble(x = 0:17),
                        aes(x)),
         `+`)