Setting the factor levels should work. Try the following example.
library(ggplot2)
library(dplyr)
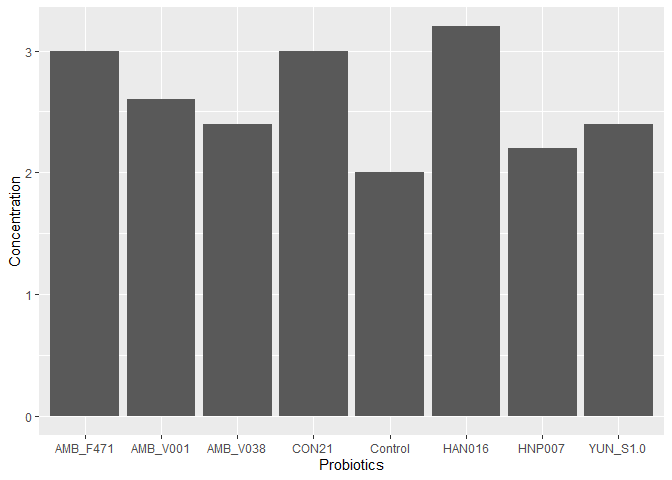
FC <- data.frame(Probiotics = c("Control", "YUN_S1.0", "AMB_F471",
"AMB_V001", "AMB_V038", "HAN016",
"HNP007", "CON21"),
Concentration = c(2, 2.4, 3, 2.6, 2.4, 3.2, 2.2, 3))
ggplot(FC, aes(x = Probiotics, y = Concentration)) + geom_col()
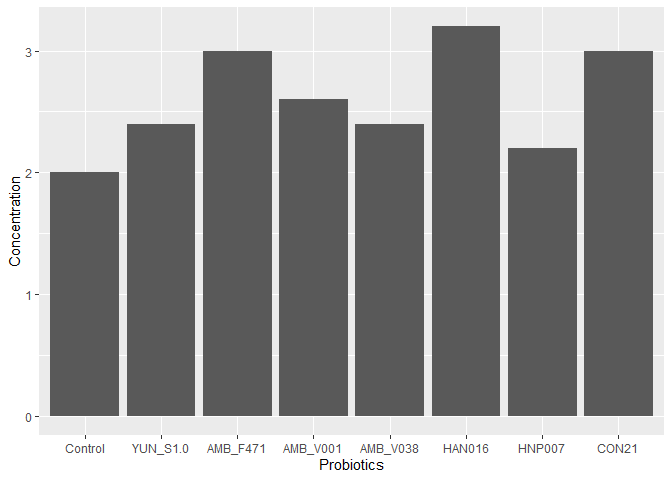
FC <- FC %>% mutate(Probiotics=factor(Probiotics,
                                      levels=c("Control", "YUN_S1.0", "AMB_F471",
                                               "AMB_V001", "AMB_V038", "HAN016",
                                               "HNP007", "CON21"), ordered=TRUE))
ggplot(FC, aes(x = Probiotics, y = Concentration)) + geom_col()
Created on 2020-04-11 by the reprex package (v0.3.0)