library(tidyverse)
library(gapminder)

gapminder %>%
  filter(year = 1952) %>%
  group_by(continent) %>%
  summarize(avg_lifeExp = mean(lifeExp)) %>%
  ggplot(aes(x = country, y = lifeExp)) +
  geom_col()
#> Error: Problem with `filter()` input `..1`.
#> x Input `..1` is named.
#> ℹ This usually means that you've used `=` instead of `==`.
#> ℹ Did you mean `year == 1952`?
library(tidyverse)
library(reprex)
library(dslabs)
murders +
  arrange(murders) +
  head(10)
#> Error in FUN(left, right): non-numeric argument to binary operator
Created on 2020-09-21 by the reprex package (v0.3.0)
I've fallen and I can't get up!
## you can put any code here!
library(tidyverse)

diamonds %>%
  slice(1:5) %>%
  select(depth, cut, appeal, clarity)
#> Error: Can't subset columns that don't exist.
#> x Column `appeal` doesn't exist.
you can put any code here!
library(tidyverse)
diamonds %>%
slice(1:5) %>%
select(depth, cut, appeal, clarity)
#> Error: Can't subset columns that don't exist.
#> x Column appeal doesn't exist.
library(tidyverse)

diamonds %>%
  slice(1:5) %>%
  select(depth, cut, appeal, clarity)
#> Error: Can't subset columns that don't exist.
#> x Column `appeal` doesn't exist.
This is just a test!
ggplot(iris)+
  geom_bar(aes(Species, Petal.Width))
#> Error: stat_count() can only have an x or y aesthetic.
Created on 2020-09-21 by the reprex package (v0.3.0)
Help! I can't get my new column to show up.
library(reprex)
library(dslabs)
library(tidyverse)

data("murders")

murders %>%
  mutate(rate = (total/poopulation)*10e5)
#> Error: Problem with `mutate()` input `rate`.
#> x object 'poopulation' not found
#> ℹ Input `rate` is `(total/poopulation) * 1e+06`.
``` r
library(reprex)
library(dslabs)
library(tidyverse)

data("murders")

murders %>%
  mutate(rate = (total/poopulation)*10e5)
#> Error: Problem with `mutate()` input `rate`.
#> x object 'poopulation' not found
#> i Input `rate` is `(total/poopulation) * 1e+06`.
I was trying to calculate the per capita rate of murders in America, but it didn't work ://////. Why does it say that poopulation was not found?
install.packages("reprex")
#>
#> The downloaded binary packages are in
#>  /var/folders/4h/6tbpzlz505v9fbtl3yphgvth0000gn/T//RtmpjAxJW1/downloaded_packages
library(reprex)
library(dslabs)
library(tidyverse)
data("murders")
murders %>%
  mutate(rate = (total/poopulation)*100000)
#> Error: Problem with `mutate()` input `rate`.
#> x object 'poopulation' not found
#> ℹ Input `rate` is `(total/poopulation) * 1e+05`.
Created on 2020-09-21 by the reprex package (v0.3.0)
Was having trouble with mutating the data.
library(tidyverse)
library(PPBDS.data)
library(reprex)
glimpse(trains)
#> Rows: 115
#> Columns: 8
#> $ gender    <chr> "Female", "Female", "Male", "Male", "Male", "Female", "Fema…
#> $ liberal   <lgl> FALSE, FALSE, TRUE, FALSE, TRUE, FALSE, FALSE, FALSE, FALSE…
#> $ party     <chr> "Democrat", "Republican", "Democrat", "Democrat", "Democrat…
#> $ age       <dbl> 31, 34, 63, 45, 55, 37, 53, 36, 54, 42, 33, 50, 24, 40, 53,…
#> $ income    <dbl> 135000, 105000, 135000, 300000, 135000, 87500, 87500, 13500…
#> $ att_start <dbl> 11, 9, 3, 11, 8, 13, 13, 10, 12, 9, 10, 11, 13, 6, 8, 13, 7…
#> $ treatment <fct> Treated, Treated, Treated, Treated, Control, Treated, Contr…
#> $ att_end   <dbl> 11, 10, 5, 11, 5, 13, 13, 11, 12, 10, 9, 9, 13, 7, 8, 13, 8…
Created on 2020-09-21 by the reprex package (v0.3.0)
Testing a possible problem
library(tidyverse)
library(gapminder)
library(gganimate)
#> Error in library(gganimate): there is no package called 'gganimate'
theme_set(theme_bw())
head(gapminder)
#> # A tibble: 6 x 6
#>   country     continent  year lifeExp      pop gdpPercap
#>   <fct>       <fct>     <int>   <dbl>    <int>     <dbl>
#> 1 Afghanistan Asia       1952    28.8  8425333      779.
#> 2 Afghanistan Asia       1957    30.3  9240934      821.
#> 3 Afghanistan Asia       1962    32.0 10267083      853.
#> 4 Afghanistan Asia       1967    34.0 11537966      836.
#> 5 Afghanistan Asia       1972    36.1 13079460      740.
#> 6 Afghanistan Asia       1977    38.4 14880372      786.

p <- ggplot(gapminder,
            aes(x = gdpPercap, y=lifeExp, size = pop, colour = country)) +
  geom_point(show.legend = FALSE, alpha = 0.7) +
  scale_color_viridis_d() +
  scale_size(range = c(2, 12)) +
  scale_x_log10() +
  labs(x = "GDP per capita", y = "Life expectancy") + transition_time(year) +
  labs(title = "Year: {frame_time}")
#> Error in transition_time(year): could not find function "transition_time"

p + facet_wrap(~continent) +
  transition_time(year) +
  labs(title = "Year: {frame_time}")
#> Error in eval(expr, envir, enclos): object 'p' not found


p + transition_time(year) +
  labs(title = "Year: {frame_time}") +
  view_follow(fixed_y = TRUE)
#> Error in eval(expr, envir, enclos): object 'p' not found
Created on 2020-09-21 by the reprex package (v0.3.0)
library(reprex)
library(dslabs)
library(tidyverse)
data("murders")

murders %>%
  mutate(murders= list())
#> Error: Problem with `mutate()` input `murders`.
#> x Input `murders` can't be recycled to size 51.
#> ℹ Input `murders` is `list()`.
#> ℹ Input `murders` must be size 51 or 1, not 0.
Created on 2020-09-21 by the reprex package (v0.3.0)
library(dslabs)
library(tidyverse)

data("murders")

#plot murders by population
ggplot(data = murders, mapping = aes(x = population, y = total)) +
  geom_point()
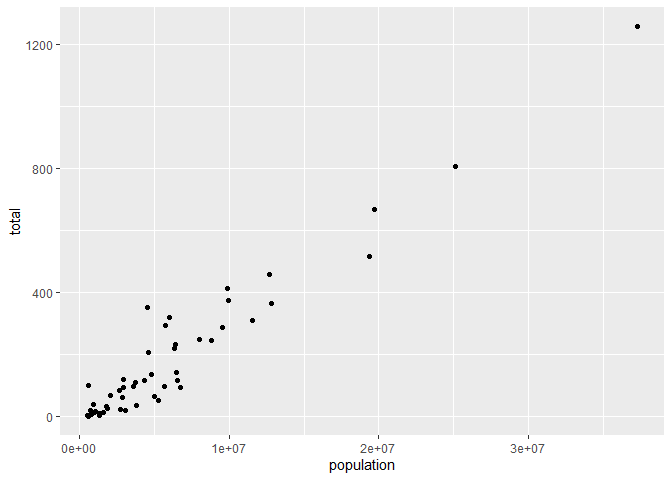
Created on 2020-09-21 by the reprex package (v0.3.0)
problem!
qscores %>%
  filter(department == "HISTSCI") %>%
  ggplot( aes(x = hours, y = rating, color = term)) + geom_point() +
  geom_smooth() +
  labs(title = "Hours vs. Rating in the HITSCI Department", x = "Workload", y = "Rating")
#> Error in qscores %>% filter(department == "HISTSCI") %>% ggplot(aes(x = hours, : could not find function "%>%"
Created on 2020-09-21 by the reprex package (v0.3.0)
## you can put any code here!
library(tidyverse)

diamonds %>%
  slice(1:5) %>%
group_by(appeal)
#> Error: Must group by variables found in `.data`.
#> * Column `appeal` is not found.
## you can put any code here!
library(tidyverse)

diamonds %>%
  slice(1:5) %>%
  select(depth, cut, appeal, clarity)
#> Error: Can't subset columns that don't exist.
#> x Column `appeal` doesn't exist.

diamonds %>%
  selct(cut, clarity)
#> Error in selct(., cut, clarity): could not find function "selct"
library(ggplot2)
ggplot(diamonds, aes(x= depth, y=price, color= x)) +
    geom_point() +
    scale_color_brewer()
#> Error: Continuous value supplied to discrete scale
sep_old <-
  read_excel("old_data/class_enrollment_summary_by_term_9-1-2020.xlsx",
             skip = 3) %>%
  clean_names() %>%
  filter(! is.na(course_title)) %>%
  select(-grad, -non_degree, -x_reg, -vus, -employee,
         -withdraw, -total, -instructor_full_name, -course_section_code) %>%
  rename(id = course_id,
         title = course_title,
         name = course_name,
         department = course_department) %>%
  filter(u_grad > 10) %>%
  group_by(title) %>%
  mutate(total_ugrad_old = sum(u_grad)) %>%
  select(-u_grad) %>%
  distinct(title, .keep_all = TRUE)
#> Error in read_excel("old_data/class_enrollment_summary_by_term_9-1-2020.xlsx", : could not find function "%>%"
Created on 2020-09-22 by the reprex package (v0.3.0)