Hi, one additional interesting thing,
I am not able to add breaks description on the mosaic plot.
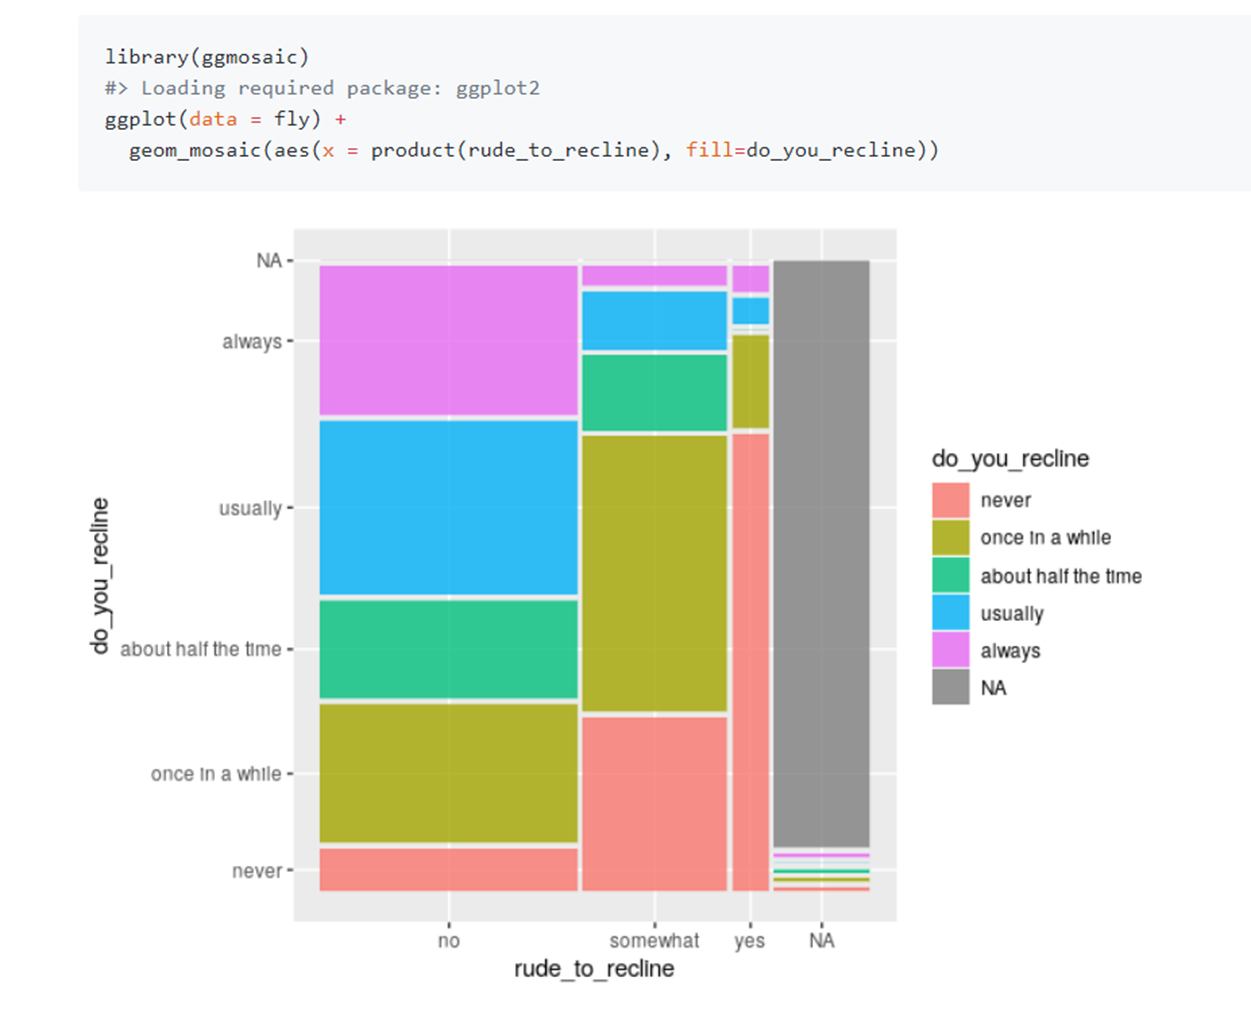
Even when I try the code from the author's webiste:
https://github.com/haleyjeppson/ggmosaic
this code gives this plot (with breaks description):
but in my RStudio the same code gives me this plot (without brakes description):
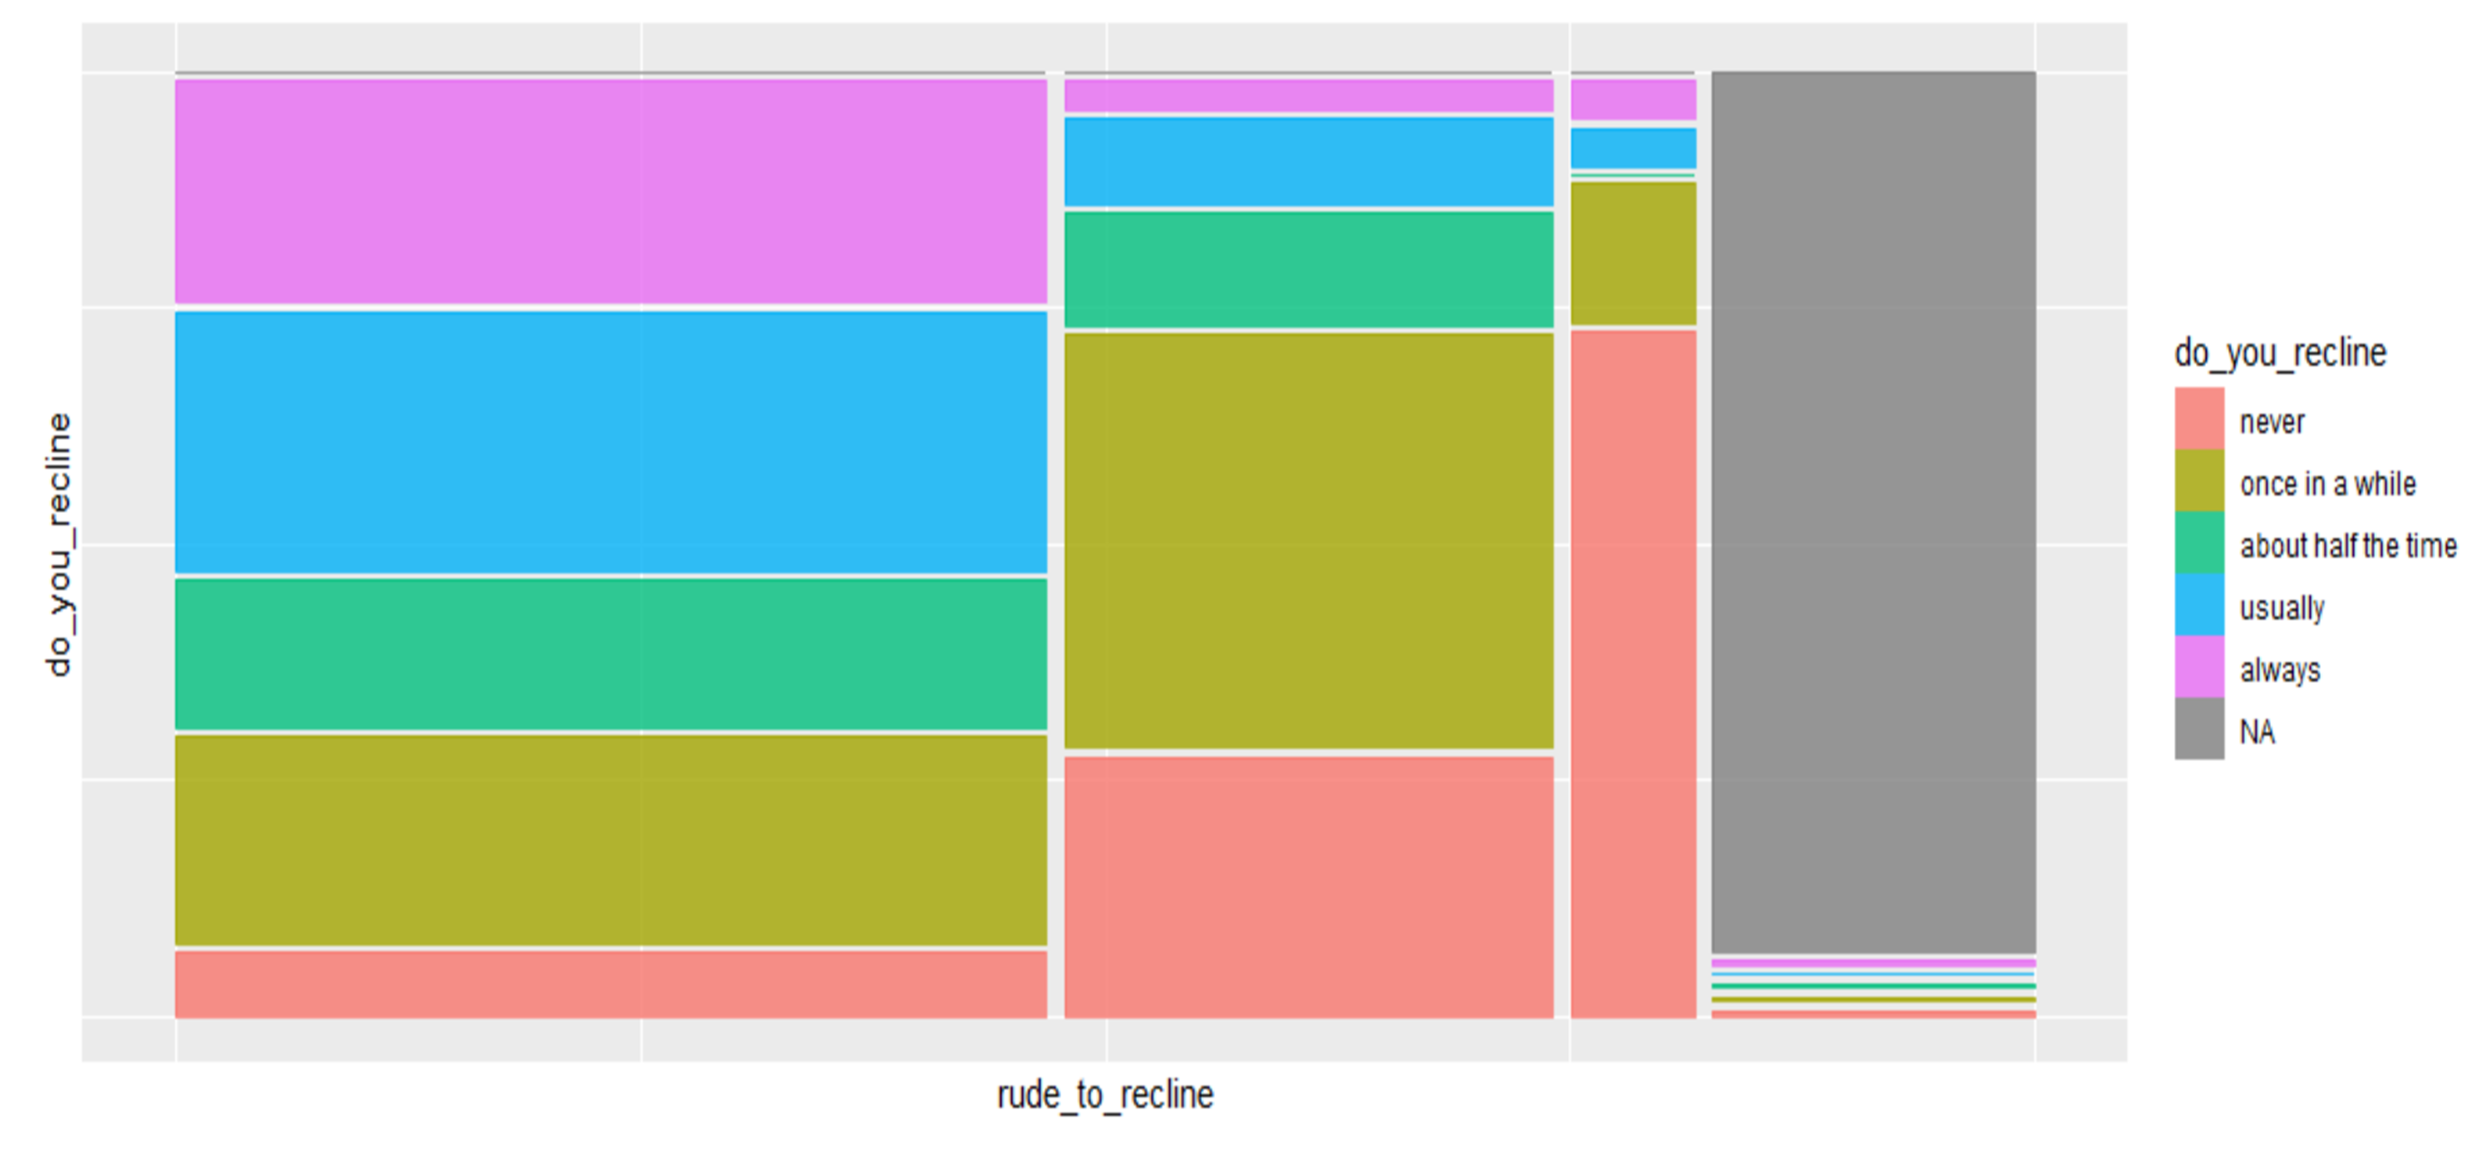
Any idea why is that ? I use windows 10 x64, R 3.6.2, RStudio 1.4.52 and 1.3.911 (preview).