a question about cut fuction

Hello

I am expected to create a new Age variable with quantiles. Upper bounds of the classes which are in the "middle" should be excluded. So the levels should look like this:
Levels: [20,30] [30,40) [40,50]

I tried this (and many more commands):
cut(don_ind$Age, breaks = c(20, 30, 40, 50), include.lowest = TRUE, right = FALSE)

But it didn't work. Do you have any idea?

Thank you.

I think we need a see your code and some sample data.

You might find CUT in R

Thank you for your answer. Please fnd below some sample data:

image

Ans this is the code:
cut(don_ind$Age, breaks = c(20, 30, 40, 50), include.lowest = TRUE, right = FALSE)

Hello,
I'm sure you shared this image with the best intentions, but perhaps you didnt realise what it implies.
If someone wished to use example data to test code against, they would type it out from your screenshot...

This is very unlikely to happen, and so it reduces the likelihood you will receive the help you desire.
Therefore please see this guide on how to reprex data. Key to this is use of either datapasta, or dput() to share your data as code

A handy way to supply some sample data is the dput() function. In the case of a large dataset something like dput(head(mydata, 100)) should supply the data we need. Just do dput(mydata) where mydata is your data. Copy the output and paste it here.

1 Like

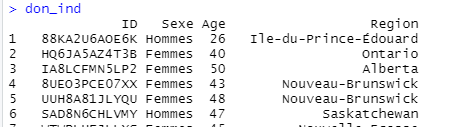
This is not probably what you mean. But thank you though:

dput(head(don_ind, 100))
structure(list(ID = c("88KA2U6AOE6K", "HQ6JA5AZ4T3B", "IA8LCFMN5LP2",
"8UEO3PCE07XX", "UUH8A81JLYQU", "SAD8N6CHLVMY", "WTWPLHFJLLXS",
"L5RG1JO68E82", "YUCNWXK1AZQL", "VD4PN7XC7B0D", "FACED2LOU7A4",
"QVUXGAC5YSEP", "Z2ER73W064CM", "TWVO6F0NIEMM", "9KPD4G0BHISJ",
"0PALZVHZCWOI", "CEW6N5J2T5IE", "UKRPBR1ZHE2B", "NDKKFXDOE07S",
"JZUUIN8W29FV", "I55NX5DGPBXY", "61LTIITHE509", "VJCHJPP7O2G0",
"R5DQXWQMZH7O", "H22J09R44IJZ", "0OGELQFVC321", "4FVPW2VP7YT2",
"X86A81CUZQQ3", "238P1IXZFMDJ", "JV62N6PZQ2GL", "DZFR2DN8HIIB",
"3XR61KX8D8ID", "GX9K9I2DMRTU", "0ZT5WA0URUGY", "DJXJOSNIM5W2",
"WSVV8HR7FIX3", "U0G292A03D4N", "WF77UDDYI94W", "SUS7J52SJMMT",
"9YB29VZGHD98", "5307S9J8O21Y", "FQO6V073PTFH", "ZBV07SCATBXN",
"5AY4366QQXXS", "8GL62YDUMWNZ", "96VDVX8B9GUF", "6CT9WZ43D1H2",
"N71K6J257XPL", "64O9516N9RSB", "HADDTUOCDOOM", "QJL12653JPT9",
"XOEW9LLDUXRP", "SVY7PY2J6I3A", "IAAGWIUBE9HJ", "VCFEHS5768O8",
"XVMIC9GWBP9N", "F876XR5LC5RK", "4JMH44XEY6IS", "2OELC8DT7BQF",
"OCA13TFRMGDF", "V0NNH8J6KSAD", "Y9PG3WV96QA8", "D36TM3V4QDC7",
"VU2HYFPF3O0A", "XPZTPC4TS4YW", "EZYPCIREYKUY", "3Q8K3IDSX390",
"A39RE6FXKC9Y", "T67L2G50TIRV", "IEETVGXAEP2A", "FN1NZQ6S9IKN",
"IB933IKA9CKN", "8Y6O60K25AC1", "3PHC26VY15PZ", "PXG590IY0AB3",
"51YZJMVBLQPR", "44ODR7ARTQXG", "9ZOHOCX2RD9K", "FSDU1YA1UCED",
"IHBSJVF998H3", "5KLASQ52A7M2", "KP7JSMK0A1UO", "IQFM972HLC4D",
"2OF2Z2T4J79I", "KT7UNYJFF85B", "75KJ2Y2UWYKC", "SZE9ZIBLXJ50",
"MRDVB9HYGZQI", "7ZN52FQUUJ4O", "OOH60LO4TAAR", "DCLWUMTK0BKZ",
"9F7O3X0EUJN5", "VA8GT3N1C76D", "9LZCQ89U7EIC", "MDHHCZFY6JMO",
"ONXJ8AKB9DE9", "Z5X8ZB3AL5G7", "8V40B8WTZVHD", "CYCMS470905X",
"I9LQUHT18EHR"), Sexe = structure(c(2L, 1L, 1L, 1L, 1L, 2L, 1L,
1L, 1L, 1L, 2L, 1L, 2L, 2L, 2L, 1L, 1L, 2L, 1L, 2L, 1L, 2L, 2L,
2L, 2L, 1L, 1L, 1L, 1L, 2L, 2L, 1L, 1L, 1L, 2L, 1L, 2L, 2L, 2L,
1L, 2L, 1L, 2L, 2L, 1L, 2L, 1L, 1L, 2L, 2L, 2L, 2L, 1L, 1L, 2L,
2L, 1L, 1L, 1L, 1L, 1L, 2L, 2L, 2L, 2L, 2L, 2L, 2L, 2L, 2L, 2L,
2L, 2L, 1L, 2L, 1L, 2L, 1L, 2L, 1L, 2L, 1L, 2L, 1L, 1L, 1L, 1L,
1L, 2L, 2L, 2L, 1L, 1L, 1L, 2L, 1L, 2L, 1L, 1L, 2L), .Label = c("Femmes",
"Hommes"), class = "factor"), Age = c(26, 40, 50, 43, 48, 47,
45, 42, 47, 23, 45, 43, 24, 61, 38, 51, 46, 39, 42, 51, 47, 52,
43, 56, 49, 51, 49, 51, 42, 51, 49, 28, 37, 50, 31, 55, 45, 43,
52, 33, 33, 47, 47, 50, 26, 39, 56, 48, 56, 42, 41, 37, 51, 44,
41, 47, 44, 60, 43, 38, 56, 44, 55, 41, 34, 54, 45, 44, 47, 44,
43, 35, 42, 49, 35, 47, 51, 38, 43, 52, 61, 51, 36, 47, 51, 36,
51, 46, 33, 57, 41, 42, 37, 41, 50, 51, 50, 41, 46, 38), Region = structure(c(3L,
7L, 1L, 5L, 5L, 9L, 6L, 6L, 2L, 7L, 10L, 1L, 8L, 7L, 7L, 8L,
3L, 2L, 10L, 4L, 9L, 3L, 8L, 8L, 8L, 6L, 2L, 9L, 10L, 8L, 1L,
1L, 5L, 7L, 6L, 2L, 2L, 8L, 3L, 9L, 6L, 2L, 6L, 4L, 6L, 7L, 7L,
8L, 6L, 6L, 3L, 8L, 1L, 5L, 4L, 3L, 2L, 5L, 7L, 10L, 8L, 6L,
8L, 4L, 1L, 6L, 9L, 9L, 9L, 7L, 2L, 5L, 1L, 4L, 7L, 3L, 9L, 6L,
9L, 8L, 7L, 1L, 5L, 1L, 7L, 4L, 8L, 7L, 8L, 6L, 6L, 8L, 4L, 5L,
8L, 10L, 6L, 5L, 9L, 6L), .Label = c("Alberta", "Colombie-Britannique",
"Ile-du-Prince-Édouard", "Manitoba", "Nouveau-Brunswick", "Nouvelle-Ecosse",
"Ontario", "Quebec", "Saskatchewan", "Terre-Neuve et Labrador"
), class = "factor")), row.names = c(NA, 100L), class = "data.frame")

That is exactly what we wanted. Thanks.

This gives us an exact copy of your data set so before I or anyone else tries to answer your question we can do something like

class(dat1)
[1] "data.frame"

which assures us we are dealing with a data.frame and not a matrix or a table and so on.

Then we can do this:

str(dat1)
'data.frame':	100 obs. of  4 variables:
 $ ID    : chr  "88KA2U6AOE6K" "HQ6JA5AZ4T3B" "IA8LCFMN5LP2" "8UEO3PCE07XX" ...
 $ Sexe  : Factor w/ 2 levels "Femmes","Hommes": 2 1 1 1 1 2 1 1 1 1 ...
 $ Age   : num  26 40 50 43 48 47 45 42 47 23 ...
 $ Region: Factor w/ 10 levels "Alberta","Colombie-Britannique",..: 3 7 1 5 5 9 6 6 2 7 ...

which gives us the structure of the data.frame and assures us Age is numeric and we can use "cut()" on it.

BTW, none of the territories?

yes, cut. i tried all of the commands below:

cut(don_ind$Age, breaks = c(20, 30, 40, 50), include.lowest = TRUE, right = TRUE)
cut(don_ind$Age, breaks = c(20, 30, 40, 50), include.lowest = TRUE, right = FALSE)
cut(don_ind$Age, breaks = c(20, 30, 40, 50), include.lowest = FALSE, right = FALSE)
cut(don_ind$Age, breaks = c(20, 30, 40, 50), include.lowest = FALSE, right = TRUE)
cut(don_ind$Age, breaks = c(20, 30, 40, 50), right = FALSE)

but i couldn't get these levels:
[20,30] [30,40) [40,50]

(Upper bound of the "middle" should be excluded.)

Do you have to use cut?

I don't understand this? I am not sure if I have the divisions exactly as you want but if you do not have to use cut I think this gives you the same basic result.

## Assuming your data.frame is named `dat1`
library(data.table)
dat2 <-  as.data.table(dat1)  ## convert dat1 from a data.frame to a data.table

dat2[, Agegroup := fcase(
                         Age %between% c(0,  20), "A",
                         Age %between% c(21, 30), "B",
                         Age %between% c(31, 40), "C",
                         Age %between% c(41, 50), "D",
                                 default = "E")]
dat2[, Agegroup := as.factor(Agegroup)]

dat2

setDF(dat2)  ## convert dat1 from a data.table to a data.frame
             ## probably not needed but just in case.

This topic was automatically closed 21 days after the last reply. New replies are no longer allowed.

If you have a query related to it or one of the replies, start a new topic and refer back with a link.