First, you define the coordinates and turn clip = "off", to enable annotate() to plot outside of the plot. Increase the right-side plot margin to generate space for the triangle.
p <- ggplot(tib, aes(x = x, y = y, color = y)) +
  geom_point() +
  binned_scale(
    aesthetics = "color",
    scale_name = "stepsn",
    palette = function(x) c("red", "yellow", "green", "yellow", "red"),
    breaks = c(0, 5, 10, 25, 60, 100),
    limits = c(0, 100),
    show.limits = TRUE,
    guide = "colorsteps"
  ) +
  coord_cartesian(ylim = c(0, 100), xlim = c(0, 100), clip = "off") +
  theme(plot.margin = margin(r = 100))
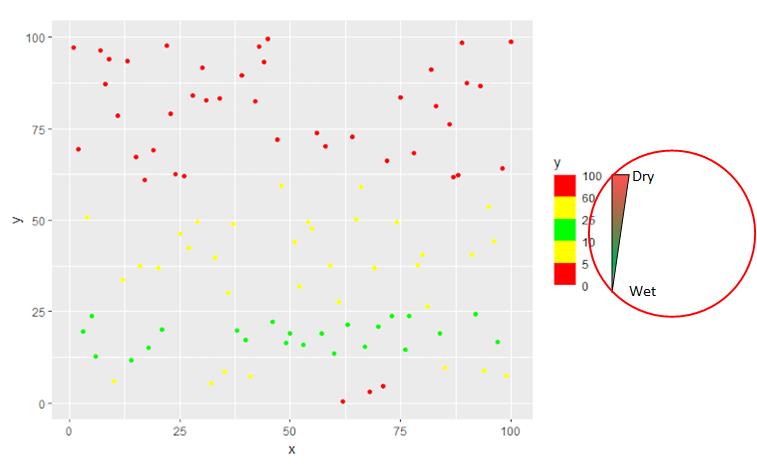
The triangle can now be added through annotate(), for example
(p + annotate(geom = "polygon", x = c(115, 115, 118), y = c(35, 60, 60), colour = "black", fill = "red"))
with x coordinates (115, 118) and y coordinates (35, 60).
My approach is to overlay many triangles while changing the fill value. This is computation heavy, but it gets the job done. My function is
tan <- (118 - 115)/(60-35)
ann_polygon <- function (y_pos, filler) {
  annotate(geom = "polygon", x = c(115, 115, 115 + (y_pos-35)*tan), y = c(35, y_pos, y_pos), colour = "NA", fill = filler)
}
where tan is the constant tangent of the bottom corner.
Define the color gradient through the function
col_function <- colorRampPalette(c("green", "red"))
col_function(10)
and loop with
steps <- seq(60, 35, -.1)
cols <- steps %>% length() %>% col_function()
i <- 1
for (step in steps) {
(p <- p + ann_polygon(step, cols[i]))
i <- i+1
}
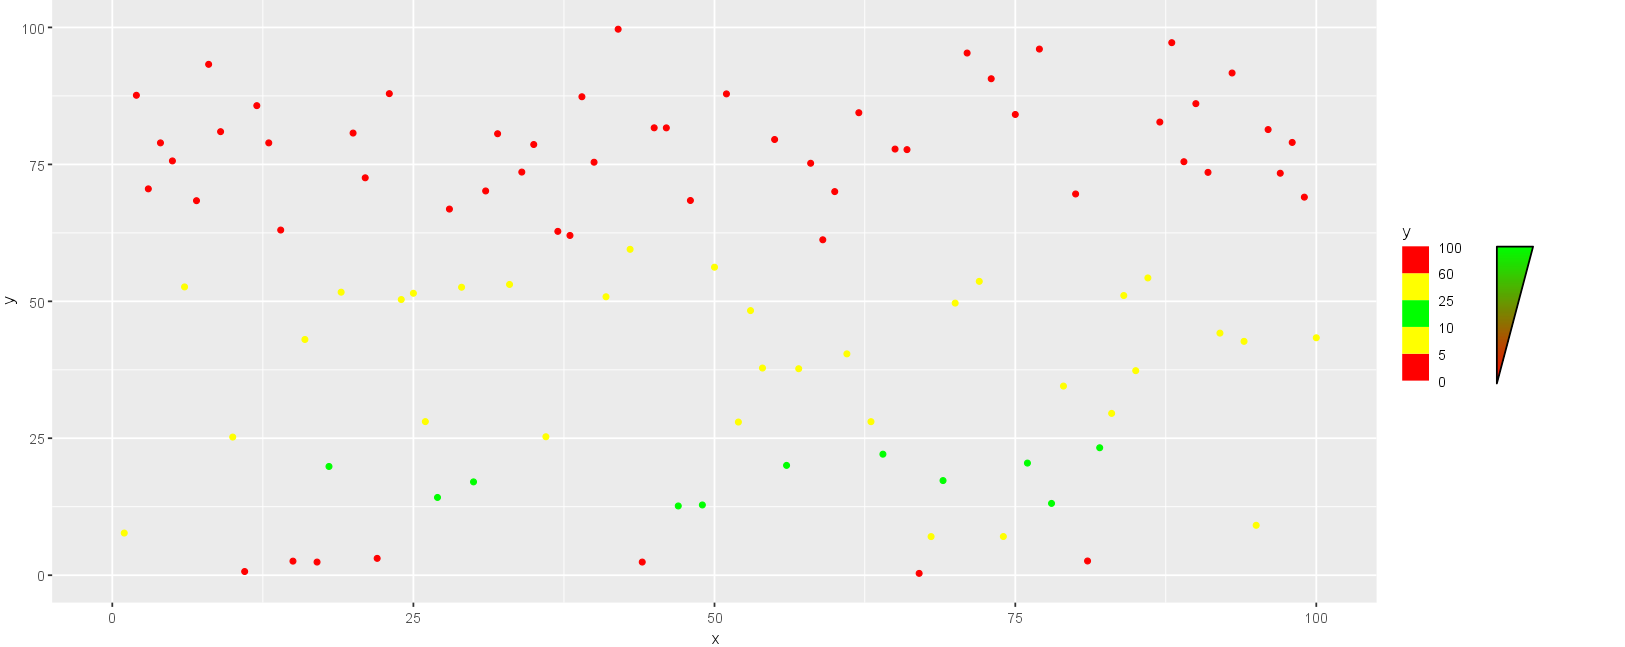
(p <- p + annotate(geom = "polygon", x = c(115, 115, 118), y = c(35, 60, 60), colour = "black", fill = NA))
to get your result.