Hello,
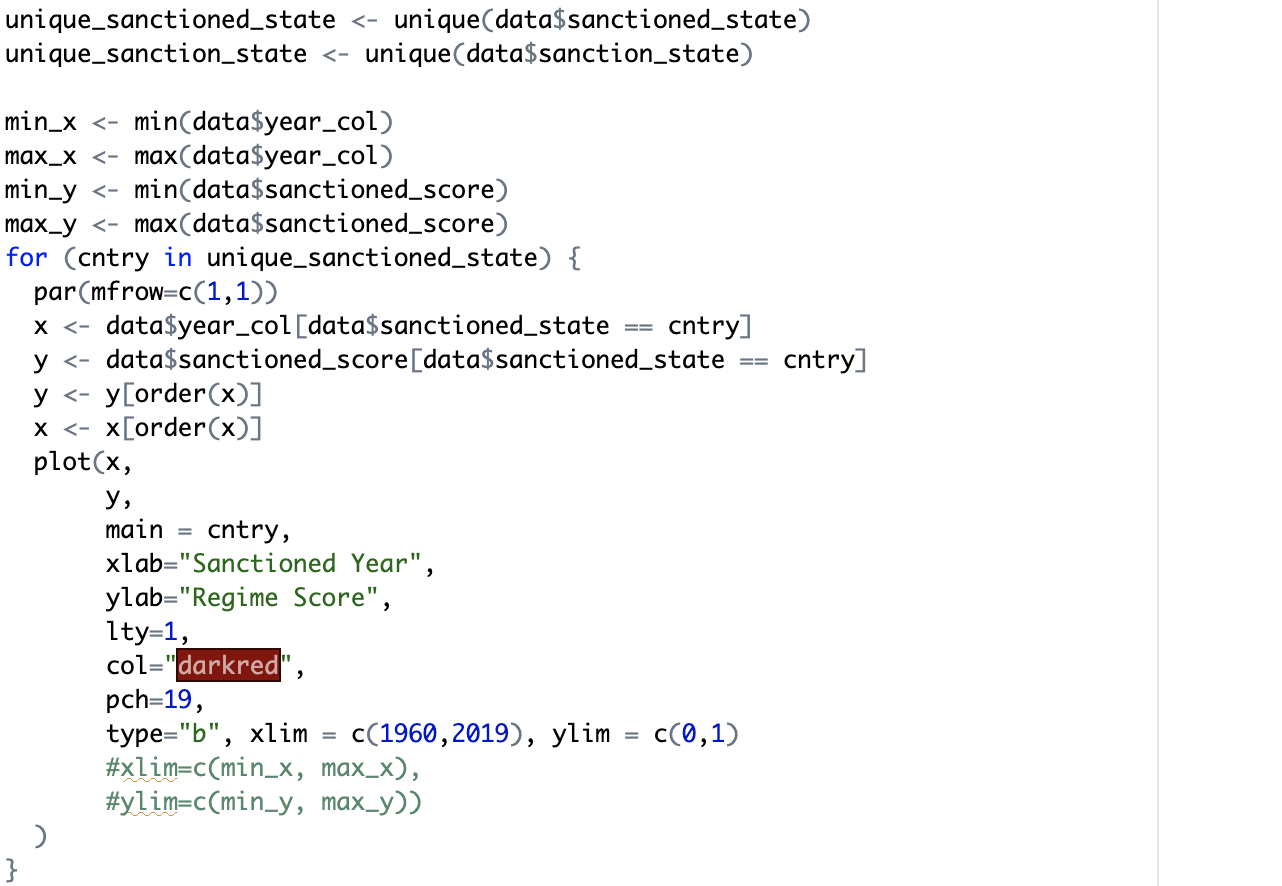
I am current working on this dataset, and have so far succeeded in plotting every countries regime score(y) the year they were sanctioned(x). Currently I am trying to add a line with the variable "sanctioned_score" to my plot, so I can see the entire regime score observations for that one country. Every time I try with the lines() function it plots for the all countries and not just the one currently graph. Does anyone now how to fix this?
Thank you in advance!