Adding grouping brackets along x-axis labels

So I have a plot that I would like to add a bracket to the axis to group further by timepoint. So an example of my data and plot code are below:

# data
> dput(head(organic_acids_t0_24hr_merged_numeric))
structure(list(Sample = c("Aer 24hr", "Aer 24hr", "Aer 24hr", 
"Aer 24hr", "Aer 24hr", "Aer 24hr"), Acid = c("Acetic Acid", 
"Butyric Acid", "Isovaleric Acid", "Lactic Acid", "Propionic Acid", 
"Succinic Acid"), Percent = c(0.08, 0.02, 0, 0.04, 0.63, 1.58
), stdev = c(0.07, 0.02, 0, 0.04, 0.41, 1.08), Treatment = c("Aer", 
"Aer", "Aer", "Aer", "Aer", "Aer"), Timepoint = c("24hr", "24hr", 
"24hr", "24hr", "24hr", "24hr")), row.names = c(NA, 6L), class = "data.frame")

# ggplot code
ggplot(organic_acids_t0_24hr_merged_numeric,
                aes(x=factor(Sample,level=c("T0","Aer 4hr",
                                            "Ana 4hr","CA 4hr",
                                            "Aer 8hr","Ana 8hr",
                                            "CA 8hr","Aer 24hr",
                                            "Ana 24hr","CA 24hr")),
                    y=Percent,fill=factor(Acid,level=c("Acetic Acid",
                                                       'Butyric Acid',
                                                       'Isovaleric Acid',
                                                       'Lactic Acid',
                                                       'Propionic Acid',
                                                       'Succinic Acid'))))+
  geom_col(position=position_dodge())+
  labs(y="% of Dry Matter by Mass")+
  scale_x_discrete(labels=c("T0","A\n4h","An\n4h","CA\n4hr",
                            "A\n8hr","An\n8hr","CA\n8hr","A\n24hr","An\n24hr","CA\n24hr"))+
  geom_errorbar(aes(ymin=Percent-stdev,
                    ymax=Percent+stdev),
                position=position_dodge())+
  scale_fill_manual(values=c("#A6CEE3","#FB9A99","#B2DF8A","#33A02C","#1F78B4",
                             "#E31A1C"))+
  theme_classic()+
  theme(axis.title.x=element_blank(),legend.title=element_blank(),
        legend.text =element_text(size=15),axis.title.y=element_text(size=15),
        legend.position="bottom",axis.text.x=element_text(size=15),
        axis.text.y=element_text(size=12),
        panel.grid.major.y=element_line(color=1,size=0.5,linetype=2),
        panel.grid.minor.y=element_line(color="black",size=0.25,linetype=3))

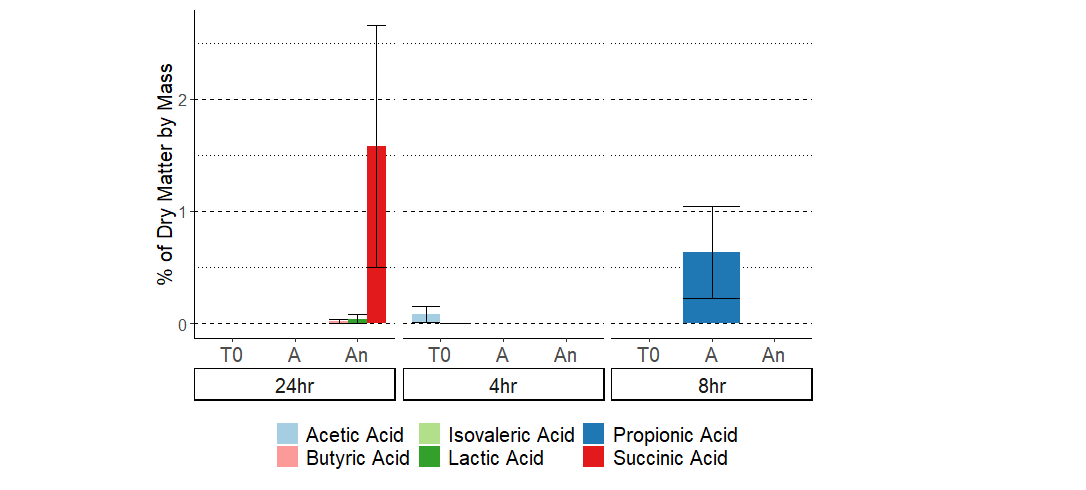
And I get a graph looking like the following

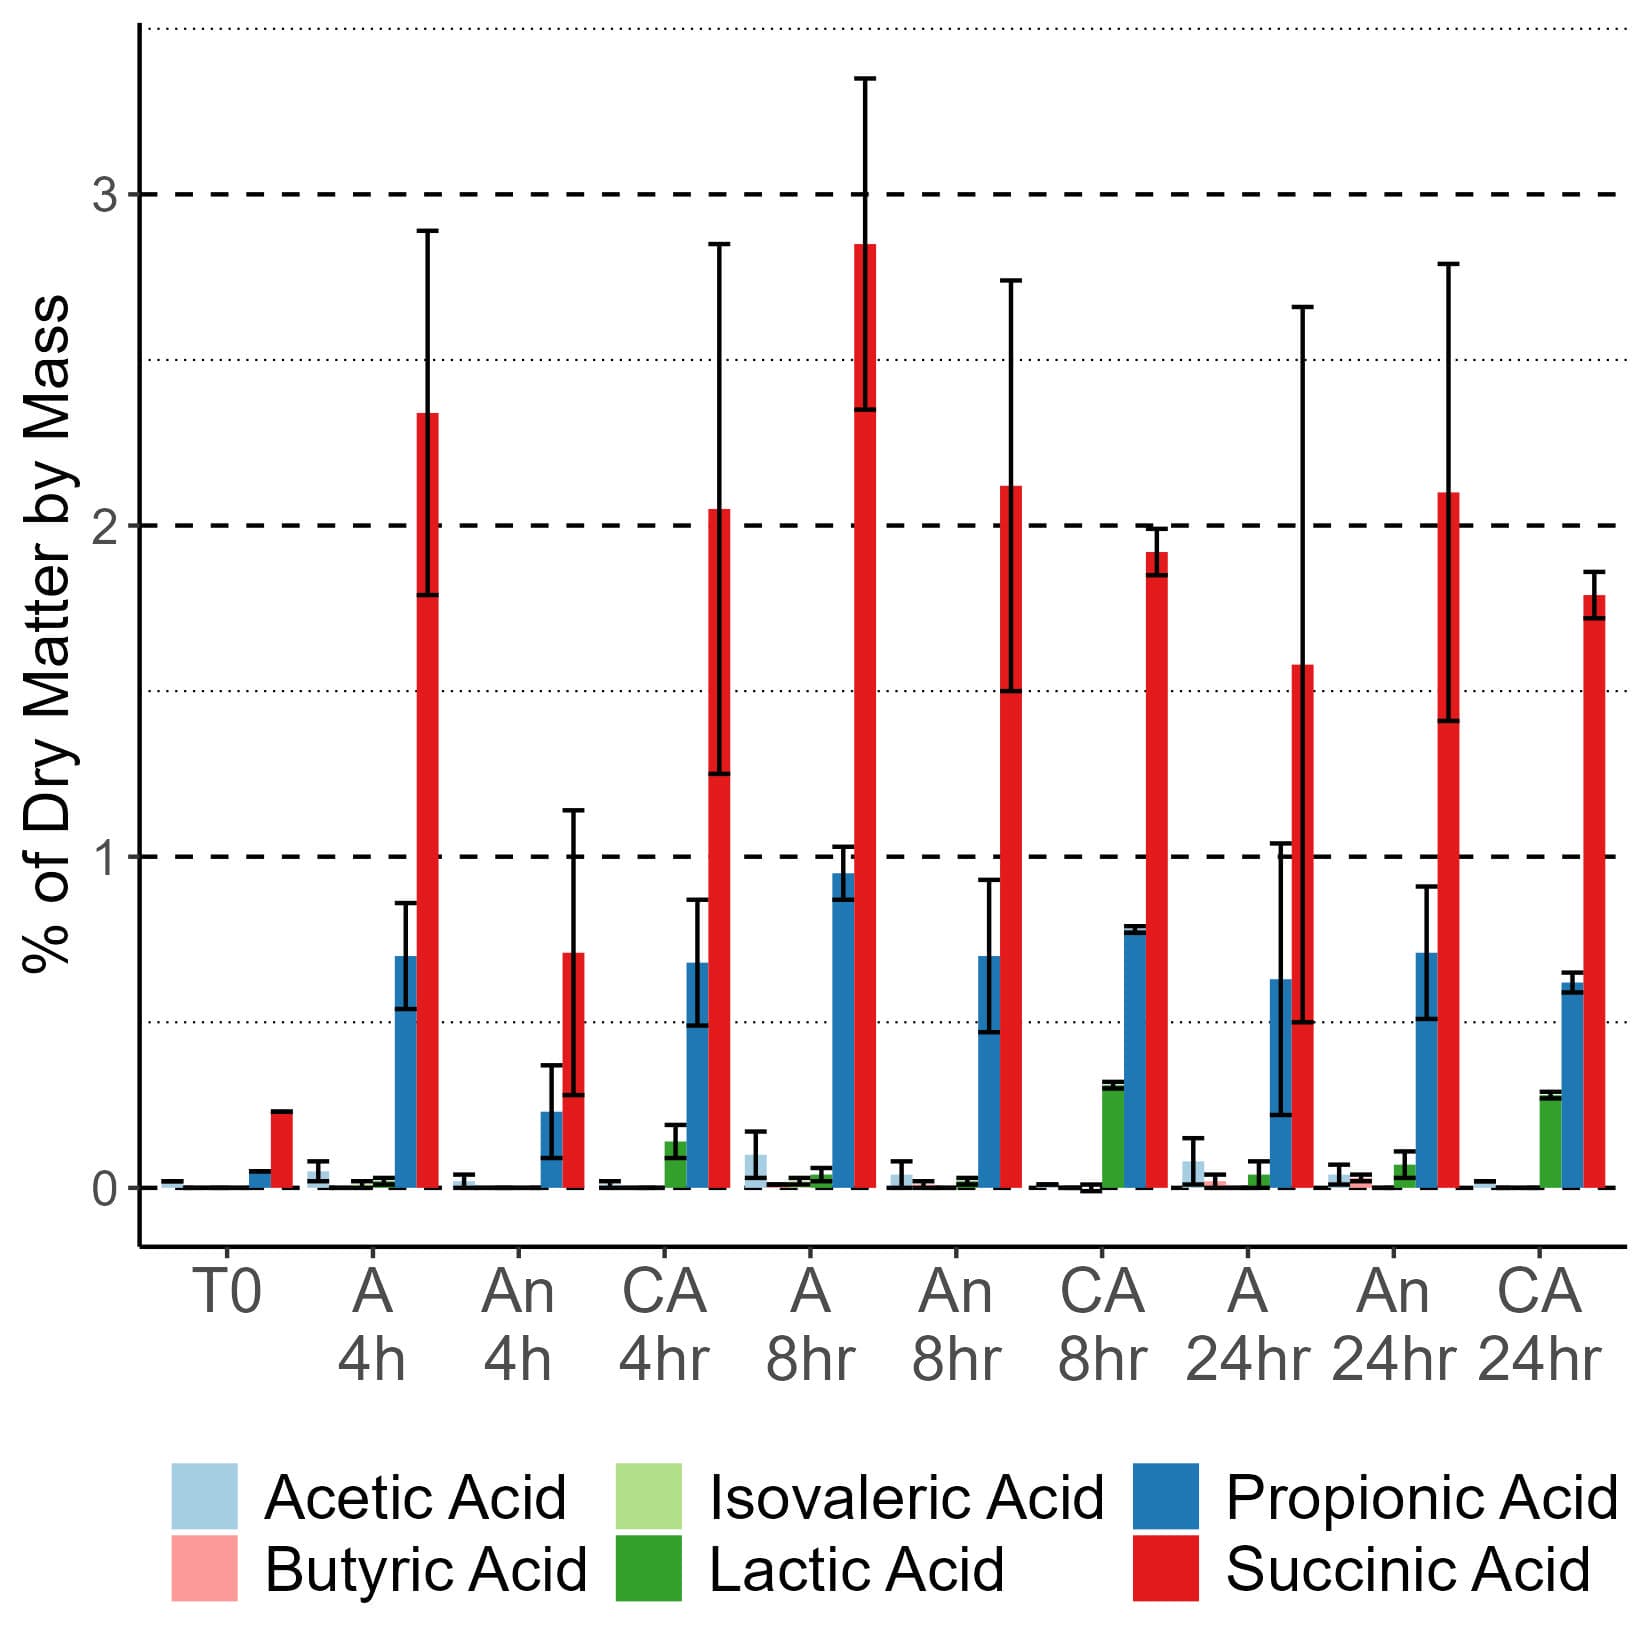
My question is, is there a way to add like a square bracket on the bottom of the graph for the time points. For example, under the A\n4hr, An\n4hr and CA\n4hr, I would like the main x-axis label to have just "A", "An", "CA", and then a square bracket underneath labeled "4 hr". Then additional brackets for the subsequent time points. I hope this makes sense.

1 Like

If I follow correctly, the example below provides the desired outcome. It uses facet_wrap() and strip.text/strip.placement arguments in theme() to create rectangular time points at the bottom (all identified with # ADDED).

library(tidyverse)

# data
organic_acids_t0_24hr_merged_numeric = 
  structure(list(Sample = c("Aer 4hr", "Aer 24hr", "Aer 4hr", 
                            "Aer 24hr", "Aer 8hr", "Aer 24hr"), 
                 Acid = c("Acetic Acid", "Butyric Acid", "Isovaleric Acid", 
                          "Lactic Acid", "Propionic Acid", "Succinic Acid"), 
                 Percent = c(0.08, 0.02, 0, 
                             0.04, 0.63, 1.58), 
                 stdev = c(0.07, 0.02, 0, 
                           0.04, 0.41, 1.08), 
                 Treatment = c("Aer", "Aer", "Aer", 
                               "Aer", "Aer", "Aer"), 
                 Timepoint = c("4hr", "24hr", "4hr", 
                               "24hr", "8hr", "24hr")), 
            row.names = c(NA, 6L), 
            class = "data.frame")

# ggplot code
ggplot(organic_acids_t0_24hr_merged_numeric,
       aes(x=factor(Sample,level=c("T0","Aer 4hr",
                                   "Ana 4hr","CA 4hr",
                                   "Aer 8hr","Ana 8hr",
                                   "CA 8hr","Aer 24hr",
                                   "Ana 24hr","CA 24hr")),
           y=Percent,fill=factor(Acid,level=c("Acetic Acid",
                                              'Butyric Acid',
                                              'Isovaleric Acid',
                                              'Lactic Acid',
                                              'Propionic Acid',
                                              'Succinic Acid'))))+
  geom_col(position=position_dodge())+
  labs(y="% of Dry Matter by Mass")+
  scale_x_discrete(labels=c("T0","A","An","CA",
                            "A","An","CA","A","An","CA"))+
  geom_errorbar(aes(ymin=Percent-stdev,
                    ymax=Percent+stdev),
                position=position_dodge())+
  scale_fill_manual(values=c("#A6CEE3","#FB9A99","#B2DF8A","#33A02C","#1F78B4",
                             "#E31A1C"))+
  theme_classic()+
  facet_wrap(~Timepoint, strip.position = 'bottom') + # ADDED
  theme(axis.title.x=element_blank(),legend.title=element_blank(),
        legend.text =element_text(size=15),axis.title.y=element_text(size=15),
        legend.position="bottom",axis.text.x=element_text(size=15),
        axis.text.y=element_text(size=12),
        panel.grid.major.y=element_line(color=1,size=0.5,linetype=2),
        panel.grid.minor.y=element_line(color="black",size=0.25,linetype=3),
        strip.text = element_text(size = 15), # ADDED
        strip.placement = 'outside' # ADDED
        )

Created on 2023-02-17 with reprex v2.0.2.9000

1 Like

This topic was automatically closed 21 days after the last reply. New replies are no longer allowed.

If you have a query related to it or one of the replies, start a new topic and refer back with a link.