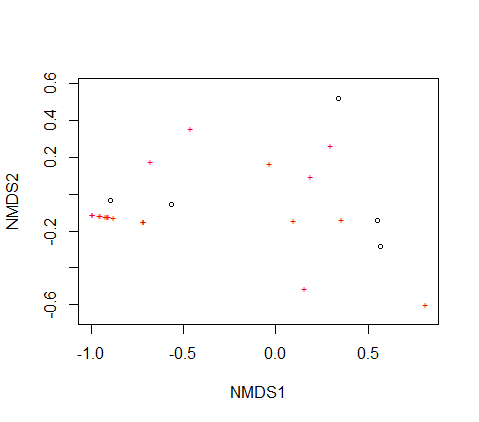
Hi this might be a stretch. I'm making an NMDS plot with data from 5 sites. One of my problems is that the plot shows both the points for my 5 sites as well as the variables that I was comparing when I only need the points for my 5 sites to show. I can't figure out how to get rid of the rest of them. My second problem is that I can't assign labels to my points so I don't know how my data is clustering. I've tried to do label=row but I'm getting a message that says
Error in (function (..., row.names = NULL, check.rows = FALSE, check.names = TRUE,  :
  arguments imply differing number of rows: 5, 21
I'm new to R and am making this graph for my capstone, my advisors don't have R experience. Any help or suggestions would be very appreciated ![]() I read through the posting guidelines and I think I followed them correctly?
I read through the posting guidelines and I think I followed them correctly?
library(vegan)
library(ggplot2)
library(ggpubr)
library(tidyverse)
library(readr)
library(readxl)
transformed_density <- read_csv("transformed_density.csv")
View(transformed_density)

## do new stuff, set data you are working with
set.seed(100)
nmds<-read.csv("transformed_density.csv")

##new stuff//you are reading columns 2 to 22 for actual data numbers
nmds_data<-nmds[,2:22]
nmds_result<-metaMDS(nmds_data,distance = "bray")
plot(nmds_result)

##
stressplot(nmds_result)
nmds_result$stress

##
nmdsscores<-as.data.frame(scores(nmds_result))
ggplot(nmdsscores,aes(NMDS1,NMDS2)) +
         geom_point()+geom_text(label=rownames_to_column(transformed_density))