I have researched in google and other related sites but did not get any ideas to keep the Y axis value as a percentage, when loading the data it's converting as number. Also can I add the high and low values of a box like below? Your reply will help me a lot. Thank you.
My Codes:
Data
dput(head(Land))
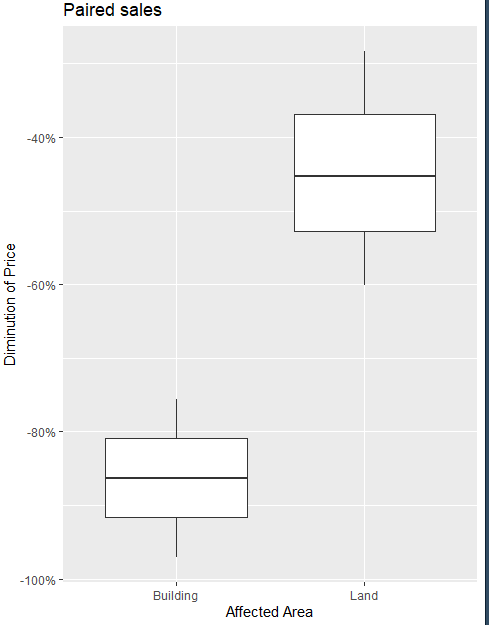
Not sure if this is what you're after. It is done with ggplot2.
library(tidyverse)

Land <- structure(list(Diminution = c(-0.755354402508729, -0.97014594368672,
                                      -0.601592445363365, -0.452736499921559, -0.283667621776504),
                       Area = c("Building", "Building", "Land", "Land", "Land")), row.names = c(NA,
                                                                                                -5L), class = c("tbl_df", "tbl", "data.frame"))

ggplot(Land, aes(Area, Diminution)) +
  geom_boxplot() +
  scale_y_continuous(labels = scales::percent_format()) +
  labs(x = "Affected Area",
       y = "Diminution of Price",
       title = "Paired sales")
system
March 19, 2023, 10:14pm
3
This topic was automatically closed 42 days after the last reply. New replies are no longer allowed.