library(shiny)
library(DiagrammeR)
library(visNetwork)
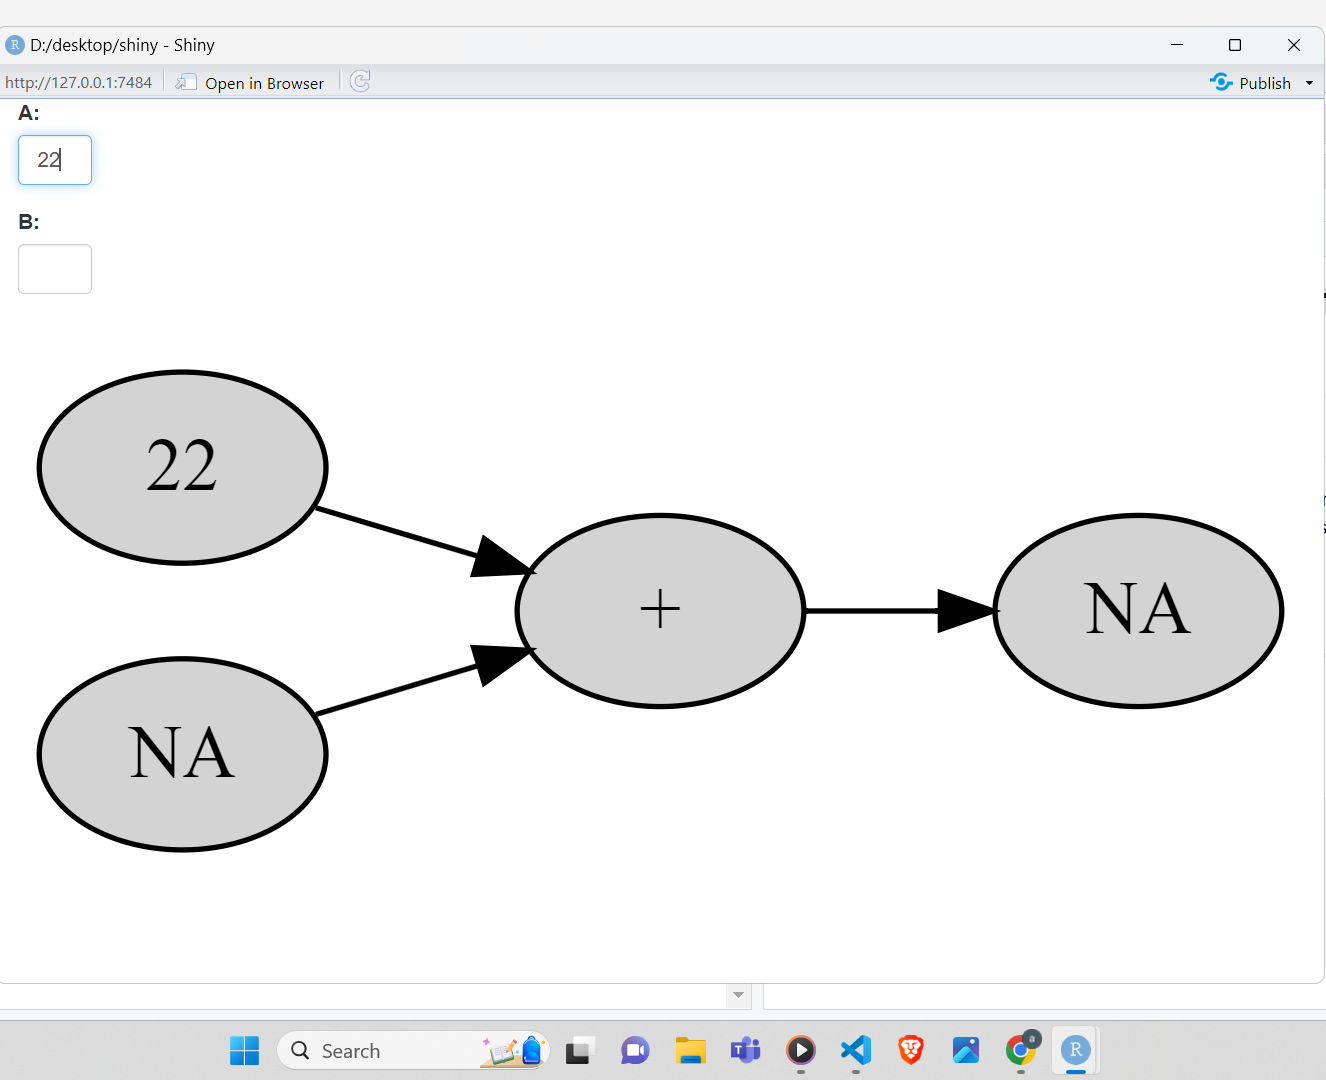
ui <- fluidPage(
textInput("node_A", " A:",width = '50px'),
textInput("node_B", " B:",width = '50px'),
grVizOutput("my_graphviz")
)
server <- function(input, output) {
output$my_graphviz <- renderDiagrammeR({
# Convert inputs to integers
node_A <- as.integer(input$node_A)
node_B <- as.integer(input$node_B)
node_d<-(input$node_d)
# Calculate sum of node A and B
node_c <- node_A + node_B
my_graphviz <- grViz(paste0("digraph {
graph[rankdir = LR]
node[shape = ellipse, style = filled]
A[label = '", node_A, "']
B[label = '", node_B, "']
c[label = '", node_c, "']
d[label = '+", node_d, "']
edge[color = black]
A->d
B->d
d->c
}"))
my_graphviz
})
}
shinyApp(ui, server)I didnt think this was possible out of the box, and I still think so. However visNetwork has visEvents, and I asked Bings chat-ai to write code to use javascript to make a dynamic input on the chart and I arrived at this working demo.
library(shiny)
library(visNetwork)

ui <- fluidPage(
  tags$head(tags$script('
    function createInputBox(x, y) {
      var input = document.createElement("input");
      input.type = "text";
      input.style.position = "absolute";
      input.style.left = x + "px";
      input.style.top = y + "px";
      document.body.appendChild(input);
      input.focus();

      return input;
    }
  ')),
  visNetworkOutput("network")
)

server <- function(input, output) {
  nodes <- data.frame(id = 1:3, label = c("A", "B", "C"))
  edges <- data.frame(from = c(1,2), to = c(2,3))

  output$network <- renderVisNetwork({
    visNetwork(nodes, edges) %>%
      visEvents(click = "function(params) {
        if (params.nodes.length > 0) {
          var nodeId = params.nodes[0];
          var nodePosition = this.getPositions([nodeId])[nodeId];
          var canvasPosition = this.canvasToDOM({x: nodePosition.x, y: nodePosition.y});

          var inputBox = createInputBox(canvasPosition.x + this.body.container.offsetLeft,
                                        canvasPosition.y + this.body.container.offsetTop);

          inputBox.onblur = function() {
            Shiny.setInputValue('newLabel', {id: nodeId, label: inputBox.value});
            document.body.removeChild(inputBox);
          };

          inputBox.onkeydown = function(event) {
            if (event.key === 'Enter') {
              Shiny.setInputValue('newLabel', {id: nodeId, label: inputBox.value});
              document.body.removeChild(inputBox);
            }
          };
        }
      }")
  })

  observeEvent(input$newLabel,{
    nodes[input$newLabel$id,"label"] <<- input$newLabel$label
    visNetworkProxy("network") %>%
      visUpdateNodes(nodes)
  })
}

shinyApp(ui = ui, server = server)
1 Like
it is not using full window size ,can we use full window so that we can create huge graph network on full window? it is only using half part of window size,graph is visible on half of window size only.
can i use visnetwork and digrammer r functionality on one graph is yes give me one sample code which using both .
This topic was automatically closed 54 days after the last reply. New replies are no longer allowed.
If you have a query related to it or one of the replies, start a new topic and refer back with a link.