I'm using the gganimate package, and needing to change the plot to a character value according to the relevant frame being displayed.
My data, like this minimal reprex, uses transition_time. Due to some complicated factors and a possible bug in gganimate, my data must use transition_time instead of transition_states, so please don't attempt to modify this part!
In the title, how can I display the contents of myversion when the frame is on myid ? So "one" when frame is referencing myid=1, "two", when referencing myid=2, etc...
library(ggplot2)
library(gganimate)
library(dplyr)

#Make a version of mtcars suitable for the reprex
new_mtcars <-
  rbind(
    rbind((mtcars*1.5) %>%
            mutate("myversion"="one",
                   "myid"=1),
          (mtcars*2.5) %>%
            mutate("myversion"="two",
                   "myid"=2)),
    (mtcars*3.5) %>%
      mutate("myversion"="three",
             "myid"=3)
  )

#Animate
ggplot(new_mtcars, aes(x=cyl, y=mpg))+
  geom_point() +
  transition_time(myid) +
  ease_aes('linear') +
  geom_hline(yintercept=25)+
  geom_hline(yintercept=50)+
  geom_hline(yintercept=75) +
  geom_vline(xintercept=20) +
  geom_vline(xintercept=10) +
  geom_vline(xintercept=20) +
  ggtitle('myversion: {frame_time}') #Want it to say "one" when myid=1, "two" when myid=2, etc...
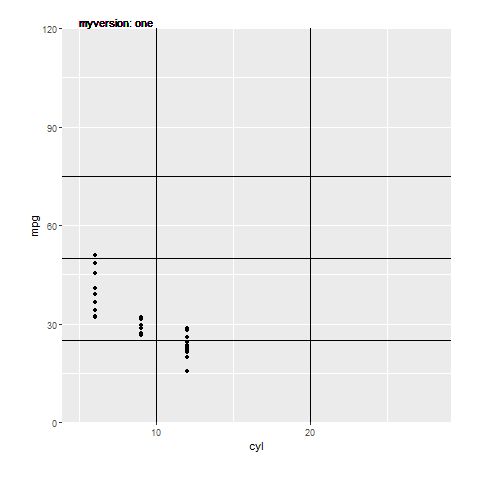
Below is one approach using xfun::numbers_to_words() to translate from a numeric to the associated number spelling, as well as a few additions to the ggplot (coord_cartesian, geom_text, and plot.margin). All are designated # NEW.
library(ggplot2)
library(gganimate)
library(dplyr)

#Make a version of mtcars suitable for the reprex
new_mtcars <-
  rbind(
    rbind((mtcars*1.5) %>%
            mutate("myversion"="one",
                   "myid"=1),
          (mtcars*2.5) %>%
            mutate("myversion"="two",
                   "myid"=2)),
    (mtcars*3.5) %>%
      mutate("myversion"="three",
             "myid"=3)
  ) %>%
  mutate(Title = paste0('myversion: ', xfun::numbers_to_words(myid))) # NEW


#Animate
ggplot(new_mtcars, aes(x=cyl, y=mpg))+
  geom_point() +
  coord_cartesian(ylim = c(0, 120), clip = 'off') + # NEW
  scale_y_continuous(expand = c(0, 0)) +
  transition_time(myid) +
  ease_aes('linear') +
  geom_hline(yintercept=25)+
  geom_hline(yintercept=50)+
  geom_hline(yintercept=75) +
  geom_vline(xintercept=20) +
  geom_vline(xintercept=10) +
  geom_vline(xintercept=20) +
  geom_text(aes(x = 5 , y = 122 , label = Title), size = 4, hjust = 0) + # NEW
  theme(plot.margin = margin(1,1,1,1,'cm')) # NEW