HI All
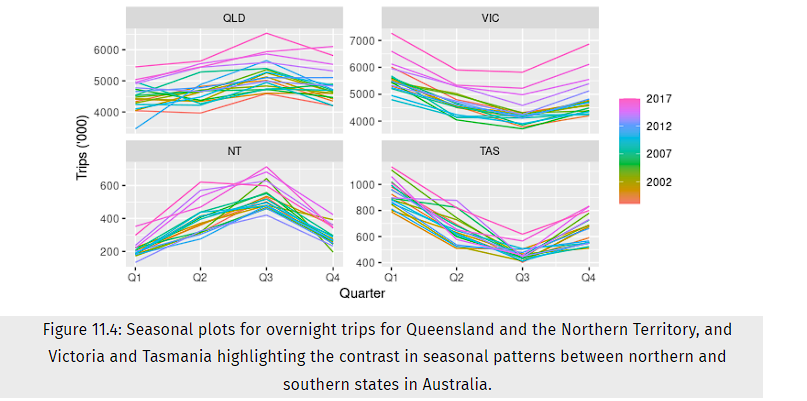
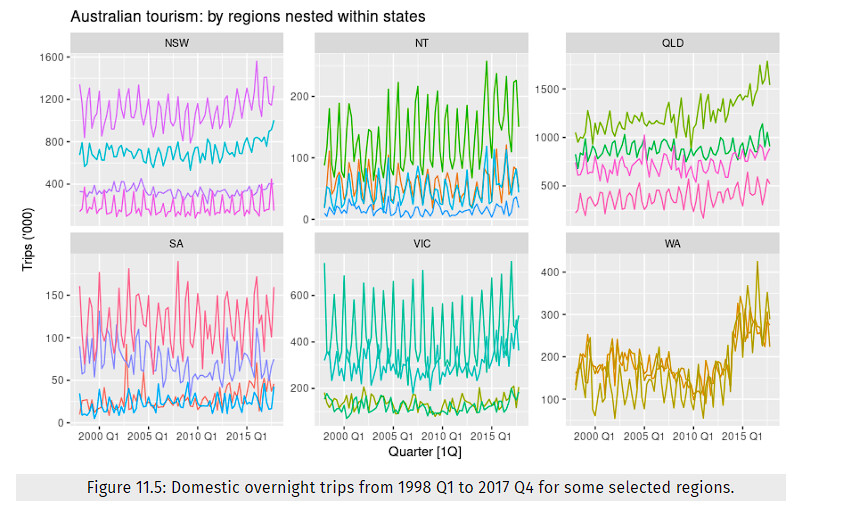
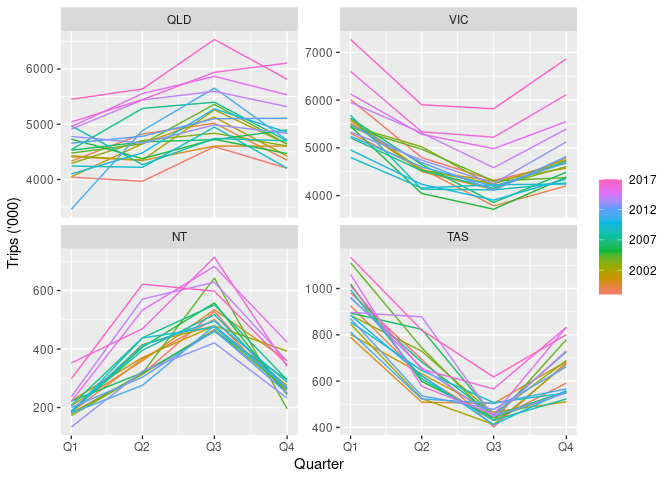
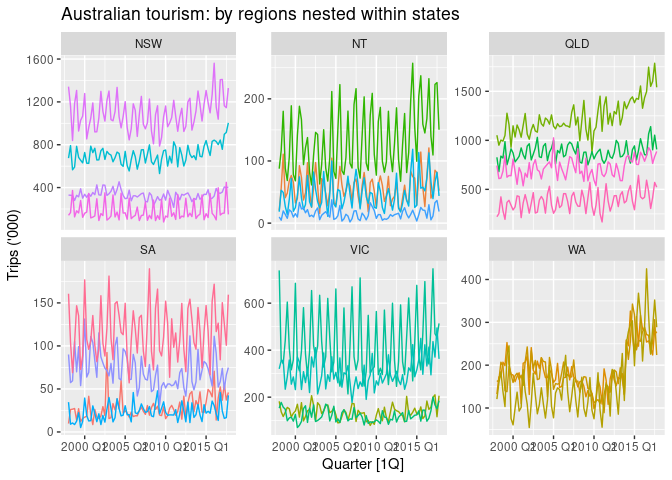
where can i get / May I get the code for those two graphs? Figure 11.4 and Figure 11.5?
thanks in advance
thanks and btw congratulations on the fable/fable tools package is really fantastic
Tony
HI All
where can i get / May I get the code for those two graphs? Figure 11.4 and Figure 11.5?
thanks in advance
thanks and btw congratulations on the fable/fable tools package is really fantastic
Tony
library(fpp3)
#> ── Attaching packages ─────────────────────────────────────── fpp3 0.4.0.9000 ──
#> ✔ tibble      3.1.8          ✔ tsibble     1.1.3
#> ✔ dplyr       1.0.10         ✔ tsibbledata 0.4.1.9000
#> ✔ tidyr       1.2.1          ✔ feasts      0.3.0.9000
#> ✔ lubridate   1.8.0          ✔ fable       0.3.2.9000
#> ✔ ggplot2     3.4.0          ✔ fabletools  0.3.2.9000
#> ── Conflicts ───────────────────────────────────────────────── fpp3_conflicts ──
#> ✖ lubridate::date()    masks base::date()
#> ✖ dplyr::filter()      masks stats::filter()
#> ✖ tsibble::intersect() masks base::intersect()
#> ✖ tsibble::interval()  masks lubridate::interval()
#> ✖ dplyr::lag()         masks stats::lag()
#> ✖ tsibble::setdiff()   masks base::setdiff()
#> ✖ tsibble::union()     masks base::union()

tourism_hts <- tsibble::tourism |>
  mutate(State = recode(State,
                        `New South Wales` = "NSW",
                        `Northern Territory` = "NT",
                        `Queensland` = "QLD",
                        `South Australia` = "SA",
                        `Tasmania` = "TAS",
                        `Victoria` = "VIC",
                        `Western Australia` = "WA"
  )) |>
  aggregate_key(State / Region, Trips = sum(Trips))

tourism_hts |>
  filter(State == "NT" | State == "QLD" |
         State == "TAS" | State == "VIC", is_aggregated(Region)) |>
  select(-Region) |>
  mutate(State = factor(State, levels=c("QLD","VIC","NT","TAS"))) |>
  gg_season(Trips) +
  facet_wrap(vars(State), nrow = 2, scales = "free_y")+
  labs(y = "Trips ('000)")
tourism_hts |>
  filter(vctrs::vec_in(Region,
    c("North Coast NSW", "Snowy Mountains", "Hunter", "New England North West",
      "Alice Springs", "Darwin", "Kakadu Arnhem", "MacDonnell", "Brisbane",
      "Gold Coast", "Northern Outback", "Sunshine Coast",
      "Tropical North Queensland", "Adelaide Hills", "Murraylands",
      "Yorke Peninsula", "Kangaroo Island", "Ballarat", "Great Ocean Road",
      "High Country", "Goulburn", "Australia's Coral Coast",
      "Australia's Golden Outback", "Australia's North West",
      "Australia's North West"))
  ) |>
  autoplot(Trips) +
  facet_wrap(State ~ ., scales = "free_y", ncol = 3) +
  labs(y = "Trips ('000)",
       title = "Australian tourism: by regions nested within states") +
  theme(legend.position = "none")
Created on 2022-12-03 with reprex v2.0.2
This topic was automatically closed 7 days after the last reply. New replies are no longer allowed.
If you have a query related to it or one of the replies, start a new topic and refer back with a link.