Matthias is correct. I'd recommend going with one of his solutions. They are much more elegant than mine.
I was not aware of the ggbeeswarm package. Time to install another package.
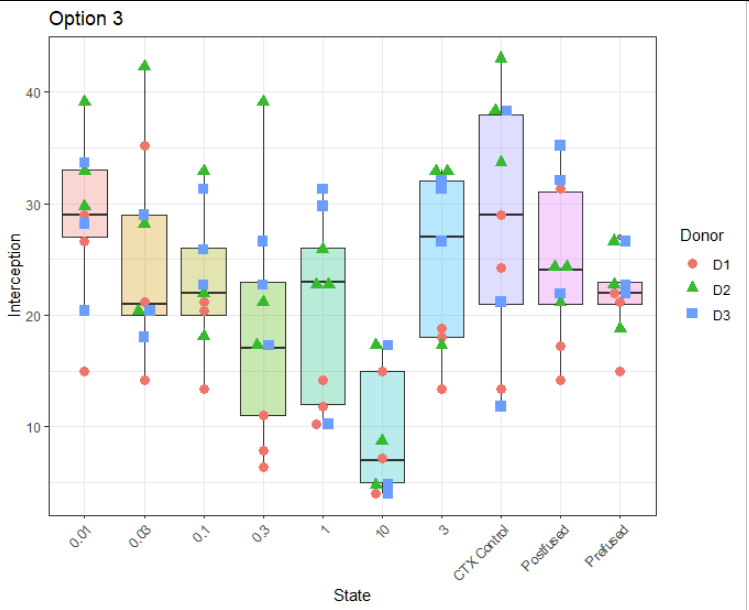
I still think it would be a good idea to use a different symbol when plotting the donors.
2 Likes
I agree. This can be easily done by adding "shape = Donor" into the aes(), e.g. of the geom_jitter(), or geom_beeswarm().
PetervB
November 24, 2022, 8:43pm
24
A 'dumstion' for jrkrideau.
Not a dumb question if you are new to R. If you are used to SAS or SPSS let alone a regular programming language R is weird .
Open a new file in RStudio
then, in the new file type
dat1 <-
Copy the data from here and paste in into the new file starting just after the <- .
Do a "select all" and then press the Run button in the top left of RStudio.
Here is a tiny example of what you want to have.
mydat  <- structure(list(Pre_fog = c(4.94, 5.24, 4.8, NA, NA), Fog = c(5.54,
5.44, 5.32, 5.53, 5.54), Post_fog = c(4.86, 4.97, 4.59, 4.77,
NA)), row.names = c(NA, 5L), class = "data.frame")
I hope this makes some sense.
PetervB
November 25, 2022, 12:05am
26
I was including the last three back-ticks along the data, and getting and error. After erasing the 3 gremlins worked like a charm
Now I'll do the homework
Excellent. As I said R is weird.
system
December 2, 2022, 1:14am
28
This topic was automatically closed 7 days after the last reply. New replies are no longer allowed.