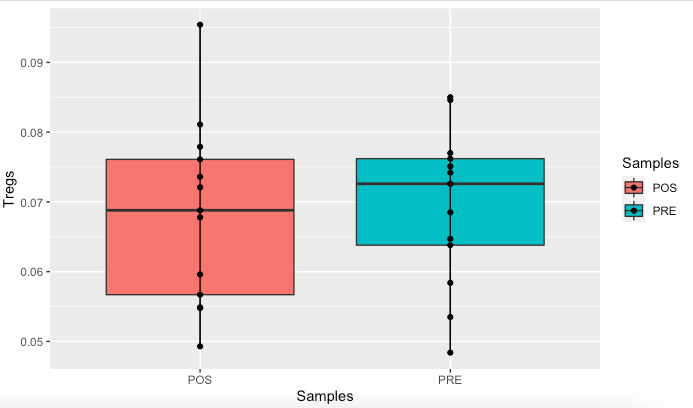
Here is my script to obtain a Boxplot with my data from excel. However, the "geom_line" option is not working. Do I need to pair my PRE and POS samples together first? If yes how?
yes indeed as otherwise its not known what to draw lines between.
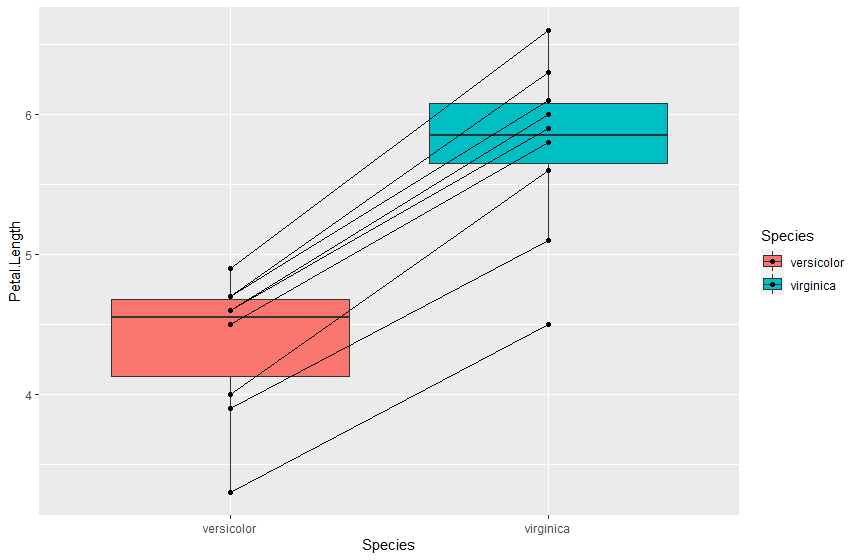
How you might do it might be context dependent, and we don't have your context..., but in the example I show, its based on creating the pairings from orderings on the two sets (Species). I find the result to be somewhat ugly and uninformative though; perhaps its more meaningful on your data given your context...
library(ggplot2)

ir2 <- iris |>
  select(Species,Petal.Length) |>
  filter(Species!="setosa") |>
  group_by(Species)  |> slice_head(n=10) |> # for this example I'll just use 10 entries
  arrange(Species,Petal.Length) |> mutate(in_group_id=row_number())


p<-ggplot(ir2, aes(x=Species,y=Petal.Length, fill=Species)) +
  geom_boxplot(notch = FALSE)+
  geom_point()+
  geom_line(aes(group=in_group_id))
p