I have the following dataset:
library(dplyr)
library(purrr)
set.seed(123)
my_data1 = data.frame(var1 =  rnorm(500,100,100), prop = runif(500, min=0, max=0.5))
my_data2 = data.frame(var1 = rnorm(500, 200, 50), prop = runif(500, min=0.4, max=0.7))
my_data = rbind(my_data1, my_data2)
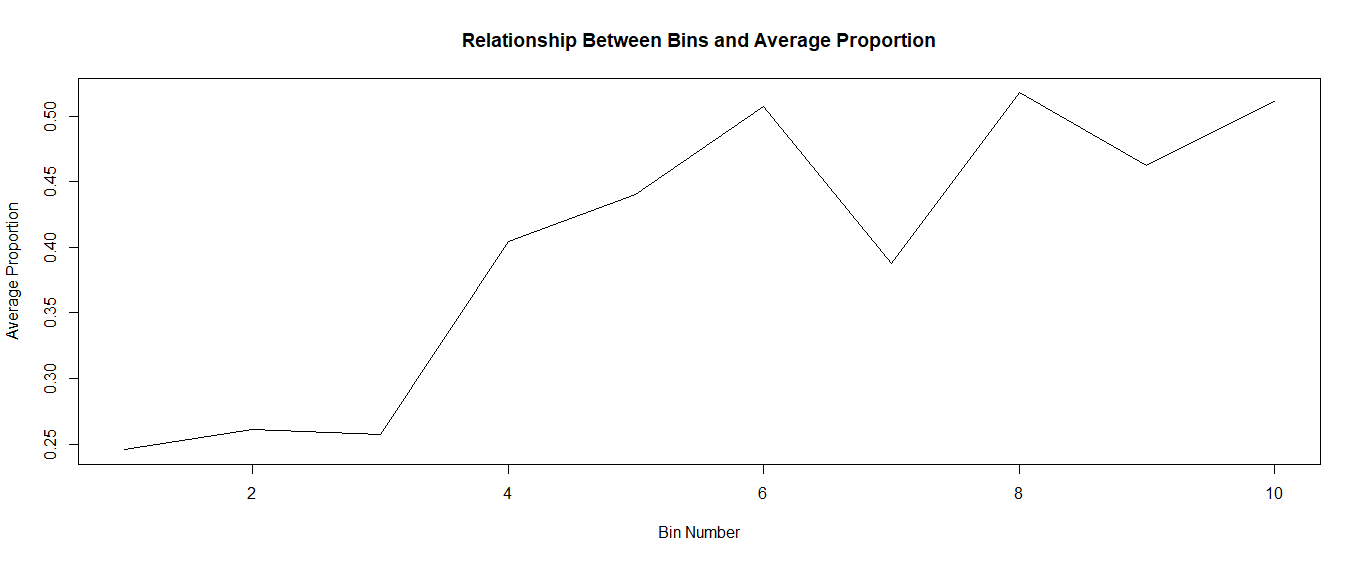
I made ten equal-sized bins, found the average proportion within each bin, then plotted the results:
final = my_data %>%
arrange(var1) %>%
mutate(ntile = ntile(var1, 10)) %>%
group_by(ntile) %>%
summarise(mean = mean(prop))

plot(final$ntile, final$mean, type = "l", xlab = "Bin Number", ylab = "Average Proportion", main = "Relationship Between Bins and Average Proportion")
Now, suppose I:
- Take a random 70% sample, create 10 bins and calculate the mean proportion within each of these bins
- Then, from the remaining 30% sample - I again take a random sample and create 10 bins and calculate the mean proportion within each of the bins
- Next, I take the squared sum of the difference between these two steps for each bin
- Finally, repeat this process many times (while tracking the results)
Below, I wrote some R code for this procedure:
base = sample_n(my_data, 700)
base_comp = base %>%
arrange(var1) %>%
mutate(ntile = ntile(var1, 10)) %>%
group_by(ntile) %>%
summarise(mean = mean(prop))
sampling_frame = my_data %>% anti_join(base)
my_list = list()
for (i in 1:1000)
{
a_i = sample_n(sampling_frame, 100)
base_a_i = a_i %>%
arrange(var1) %>%
mutate(ntile = ntile(var1, 10)) %>%
group_by(ntile) %>%
summarise(mean = mean(prop))
sum_i <- sum(map2_dbl(base_a_i$mean, base_comp$mean, function(x, y) (x - y)^2))
my_list[[i]] <- data.frame(id = i, sum_i)
print(data.frame(id = i, sum_i))
}
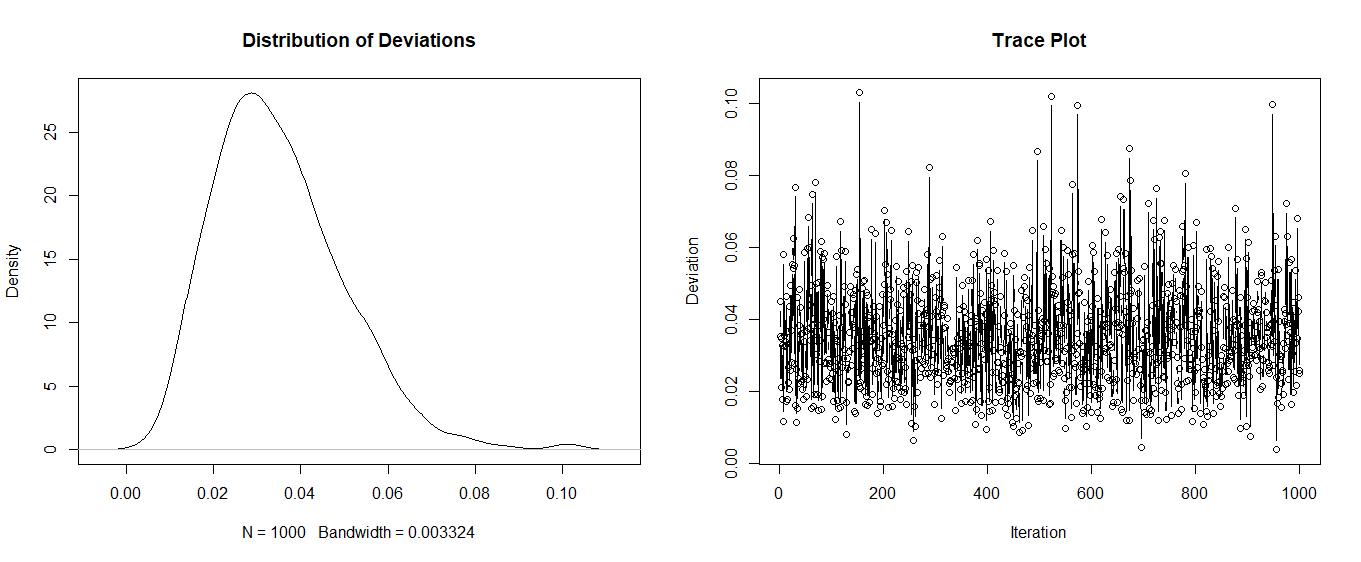
results = do.call(rbind.data.frame, my_list)
plot(density(results$sum_i), main = "Distribution of Deviations")
plot(results$id, results$sum_i, xlab = "Iteration", ylab = "Deviation", main = "Trace Plot", type = "b")
My Question: Now, I am trying to create a "double loop" - that is, I would to:
- For j = 1, randomly create "base_j" , "base_comp_j" and "sampling_frame_j"
- Repeat the "i" loop 100 times
- Take the average of all "sum_i" for j=1 (i.e. average_sum_i_j)
- Now, repeat this for j = 2
- Repeat until j = 100
- Each point on these two graphs will be "average_sum_i_j"
Here is my attempt to do this:
#  change i and j index to 10 for brevity

my_list = list()

for (j in 1:10) {
    base_j = sample_n(my_data, 700)
    base_comp_j = base_j %>%
        arrange(var1) %>%
        mutate(ntile = ntile(var1, 10)) %>%
        group_by(ntile) %>%
        summarise(mean = mean(prop))
    sampling_frame_j = my_data %>% anti_join(base_j)
    sum_i_list = list()
    for (i in 1:10) {
        a_i = sample_n(sampling_frame_j, 100)
        base_a_i = a_i %>%
            arrange(var1) %>%
            mutate(ntile = ntile(var1, 10)) %>%
            group_by(ntile) %>%
            summarise(mean = mean(prop))
        sum_i <- sum(map2_dbl(base_a_i$mean, base_comp_j$mean, function(x, y) (x - y)^2))
        sum_i_list[[i]] <- sum_i
    }
    average_sum_i_j = mean(unlist(sum_i_list))
    my_list[[j]] <- data.frame(id_j = j, id_i = i, average_sum_i_j)
    print(data.frame(id_j = j, id_i = i, average_sum_i_j))
}

results = do.call(rbind.data.frame, my_list)

plot(density(results$average_sum_i_j), main = "Distribution of Deviations")
plot(results$id, results$average_sum_i_j, xlab = "Iteration", ylab = "Deviation", main = "Trace Plot", type = "b")
However, I don't think I am doing this right since the loop does not appear to be cycling through both indices.
Can someone show me how to correct this?
Thanks!