Creating a plot of the mean of multiple trajectories

Hi everyone !

I am looking to obtain this type of graph where each trajectory/line represents a smoothed average of all the lines within a given category (either "w" or "l" in my case). Additionally, I would like to include standard error (in a more transparent color on the figure) on each line.

df

Here is a sample of my data

The values of y given in columns F10 to F110 correspond to a single data point on each trajectory/line.

I would be very grateful for any help :))
Thanks in advance.

Hello @PhonPhon and welcome to Posit Community.

It would help if you could share your example dataset in a way that is easy for your potential helpers to use. I suggest using the dput() function on your df variable and sharing the output here:

dput(df)

Ok, sure ! Here is a sample subset of my data:

dput(df)
structure(list(syllabe = c("CV", "CV", "VCs", "CV", "CV", "CVs",
"CV", "CV", "CV", "CV"), C = c("w", "w", "l", "w", "w", "l",
"w", "l", "w", "l"), V = c("e", "e", "a", "o", "e", "e", "e",
"e", "e", "e"), F10 = c(1276L, 650L, 637L, 626L, 591L, 1868L,
595L, 555L, 675L, 1787L), F11 = c(1088L, 641L, 633L, 602L, 557L,
1846L, 595L, 581L, 670L, 1932L), F12 = c(568L, 628L, 627L, 578L,
539L, 1825L, 598L, 530L, 665L, 1745L), F13 = c(571L, 604L, 619L,
608L, 528L, 1799L, 542L, 487L, 663L, 1814L), F14 = c(587L, 565L,
610L, 691L, 536L, 1774L, 486L, 490L, 660L, 1768L), F15 = c(660L,
523L, 595L, 715L, 542L, 1190L, 490L, 566L, 658L, 1735L), F16 = c(657L,
503L, 579L, 699L, 547L, 443L, 496L, 589L, 650L, 1715L), F17 = c(558L,
515L, 564L, 650L, 562L, 472L, 489L, 1797L, 641L, 1694L), F18 = c(530L,
547L, 547L, 610L, 584L, 477L, 493L, 1802L, 635L, 1687L), F19 = c(500L,
575L, 525L, 575L, 597L, 499L, 503L, 494L, 629L, 1690L), F110 = c(1771L,
532L, 507L, 585L, 572L, 641L, 530L, 580L, 492L, 504L)), row.names = c(NA,
10L), class = "data.frame")

you don't appear to have the numbers that would be suitable for x axis.
interval ?

Actually, since there are 11 columns (corresponding to measurements taken at as many time intervals), I would like the x axis to correspond to these intervals

library(tidyverse)
start_data <- tibble::tribble(
  ~syllabe,  ~C,  ~V,  ~F10,  ~F11,  ~F12,  ~F13,  ~F14,  ~F15,  ~F16,  ~F17,  ~F18,  ~F19, ~F110,
  "CV", "w", "e", 1276L, 1088L,  568L,  571L,  587L,  660L,  657L,  558L,  530L,  500L, 1771L,
  "CV", "w", "e",  650L,  641L,  628L,  604L,  565L,  523L,  503L,  515L,  547L,  575L,  532L,
  "VCs", "l", "a",  637L,  633L,  627L,  619L,  610L,  595L,  579L,  564L,  547L,  525L,  507L,
  "CV", "w", "o",  626L,  602L,  578L,  608L,  691L,  715L,  699L,  650L,  610L,  575L,  585L,
  "CV", "w", "e",  591L,  557L,  539L,  528L,  536L,  542L,  547L,  562L,  584L,  597L,  572L,
  "CVs", "l", "e", 1868L, 1846L, 1825L, 1799L, 1774L, 1190L,  443L,  472L,  477L,  499L,  641L,
  "CV", "w", "e",  595L,  595L,  598L,  542L,  486L,  490L,  496L,  489L,  493L,  503L,  530L,
  "CV", "l", "e",  555L,  581L,  530L,  487L,  490L,  566L,  589L, 1797L, 1802L,  494L,  580L,
  "CV", "w", "e",  675L,  670L,  665L,  663L,  660L,  658L,  650L,  641L,  635L,  629L,  492L,
  "CV", "l", "e", 1787L, 1932L, 1745L, 1814L, 1768L, 1735L, 1715L, 1694L, 1687L, 1690L,  504L
)

(long_data <- start_data |> select(-syllabe ,-V) |> pivot_longer(cols = -C) )

(smry_data <- long_data |> group_by(C,name) |> 
    summarise(avg=mean(value),
              stderr=sd(value)/sqrt(n()),
              upper=avg+stderr,
              lower=avg-stderr))

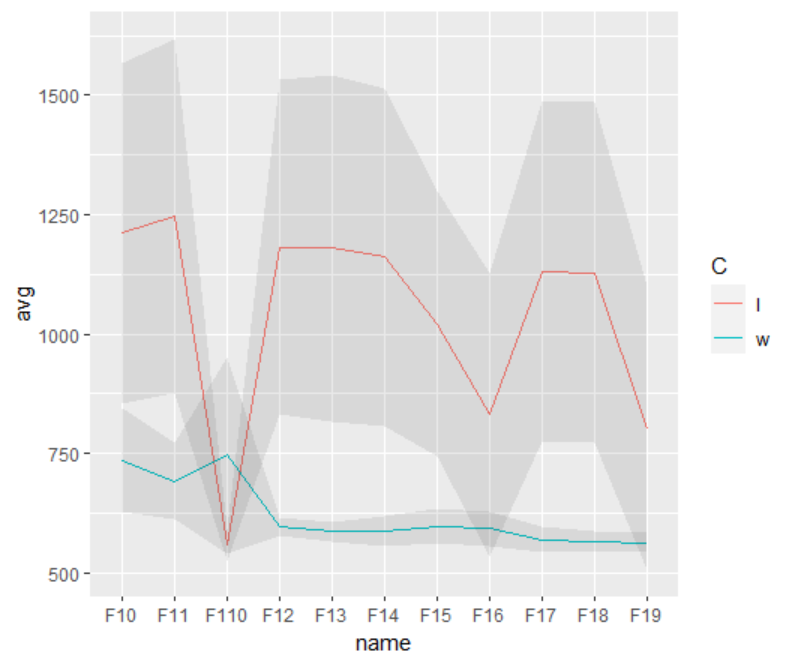
ggplot(data=smry_data) + aes(
  x=name,
  y=avg,color=C,
  group=C
) + geom_line()+
  geom_ribbon(mapping = aes(ymin=lower,
              ymax=upper),alpha=0.1,color=rgb(0,0,0,0))

1 Like

Thank you for your response! Excuse my beginner question, but I am struggling to convert my data.frame (with a few thousand rows) to the tibble (or tribble) format. I tried using datapasta::dpasta(), but I am stuck at this point.
By the way, is it possible to add a curve smoothing on the graph?

dat2  <- as_tibble(dat1)  

You dont need a tribble. A tribble is a way to turn text into a data.frame. but you start out with a data.frame. so just assume that step.

1 Like

This topic was automatically closed 42 days after the last reply. New replies are no longer allowed.

If you have a query related to it or one of the replies, start a new topic and refer back with a link.