Hi everyone, I'm fairly new to the R language and definitely statistics... I'm hoping someone can explain the difference between these 2 things to me...
I am making an NMDS plot based on Bray-Curtis dissimilarity using metaMDS and trying to draw ellipses on the plot based on a categorical variable (e.g., location). My data does NOT assume a normal distribution.
I've figured out how to draw ellipses using 2 different commands that I was able to find: stat_ellipse and geom_mark_ellipse (part of ggforce package). They produce different results on my plot. However, I don't understand what the difference between the 2 are.
From what I find, stat_ellipse is based on a 'multivariate T distribution' (Scatter plot with ELLIPSES in ggplot2 | R CHARTS) and draws an ellipse based on a 95% confidence interval and geom_mark_ellipse is based on the 'Khachiyan algorithm' (R: Annotate areas with ellipses).
Can any explain what this means in very basic terms? I am thinking I should use geom_mark_ellipse because my data is not normally distributed, but I really don't understand what the Khachiyan algorithm is...
Here is my code:
df = read.csv("nmds.csv", header = TRUE)

com = pc[,7:ncol(pc)]   ###where 7 is the column my species abundance data begins

m_com = as.matrix(com)

set.seed(123)
nmds = metaMDS(m_com, distance = "bray")
nmds

data.scores = as.data.frame(scores(nmds)$sites)
data.scores$Sample = pc$Sample
data.scores$Location = pc$Location
data.scores$Month = pc$Month
###using geom_mark_ellipse
xx = ggplot(data.scores, aes(x = NMDS1, y = NMDS2)) +
  geom_point(size = 4, aes(shape = Location, colour = Month)) +
  geom_mark_ellipse(aes(x=NMDS1, y=NMDS2, fill = Location, label = Location), con.cap=0, size = 0.2) +  theme(axis.text.y = element_text(colour = "black", size = 12),
        axis.text.x = element_text(colour = "black", size = 12),
        legend.text = element_text(size = 12, face ="bold", colour ="black"),
        legend.position = "right",
        axis.title.y = element_text(face = "bold", size = 14),
        axis.title.x = element_text(face = "bold", size = 14, colour = "black"),
        legend.title = element_text(size = 14, colour = "black", face = "bold"),
        panel.background = element_blank(), panel.border = element_rect(colour = "black", fill = NA, size = 1), legend.key=element_blank()) +  labs(x = "NMDS1", colour = "Month", y = "NMDS2", shape = "Location")  +
  geom_vline(xintercept = c(0), color = "#7D7C7C", linetype = 2) +
  geom_hline(yintercept = c(0), color = "#7D7C7C", linetype = 2) +
  scale_colour_manual(values = colours) +
  scale_shape_manual(values=c(16,1,17,2,8)) + scale_fill_viridis_d(5, direction = 1,option = "D")
xx
###using stat_ellipse
xx = ggplot(data.scores, aes(x = NMDS1, y = NMDS2)) +
  geom_point(size = 4, aes(shape = Location, colour = Month)) +
  stat_ellipse(geom = "polygon", aes(x=NMDS1, y=NMDS2, fill = Location, label = Location), alpha = 0.25, size = 0.2) + theme(axis.text.y = element_text(colour = "black", size = 12),
        axis.text.x = element_text(colour = "black", size = 12),
        legend.text = element_text(size = 12, face ="bold", colour ="black"),
        legend.position = "right",  axis.title.y = element_text(face = "bold", size = 14),
        axis.title.x = element_text(face = "bold", size = 14, colour = "black"),
        legend.title = element_text(size = 14, colour = "black", face = "bold"),
        panel.background = element_blank(), panel.border = element_rect(colour = "black", fill = NA),
        legend.key=element_blank()) + labs(x = "NMDS1", colour = "Month", y = "NMDS2", shape = "Location")  + geom_vline(xintercept = c(0), color = "#7D7C7C", linetype = 2) +
  geom_hline(yintercept = c(0), color = "#7D7C7C", linetype = 2) +
  scale_colour_manual(values = colours) + scale_shape_manual(values=c(16,1,17,2,8)) + scale_fill_viridis_d(5, direction = 1,option = "D")
xx
I've found questions in this forum that tell you how to draw an ellipses using both methods (sorry as a new user I can only put 2 links in a post) but none that explains the difference between the 2.
Here are also pictures of the different methods as they produce different results.
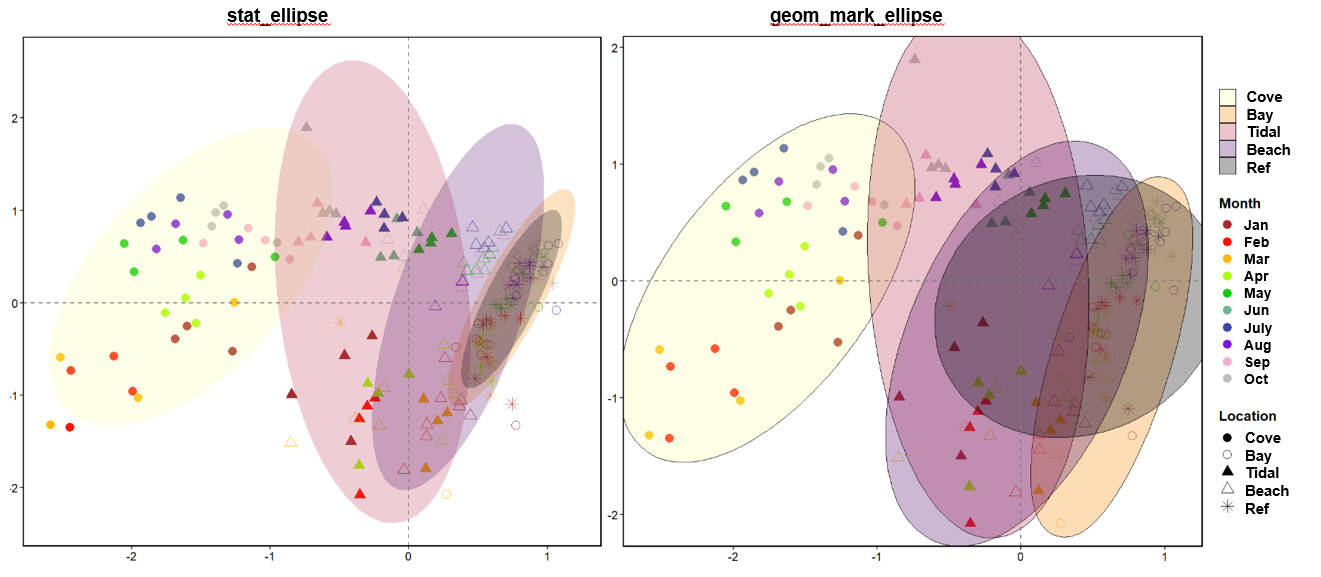
Thank you so much for your time!!