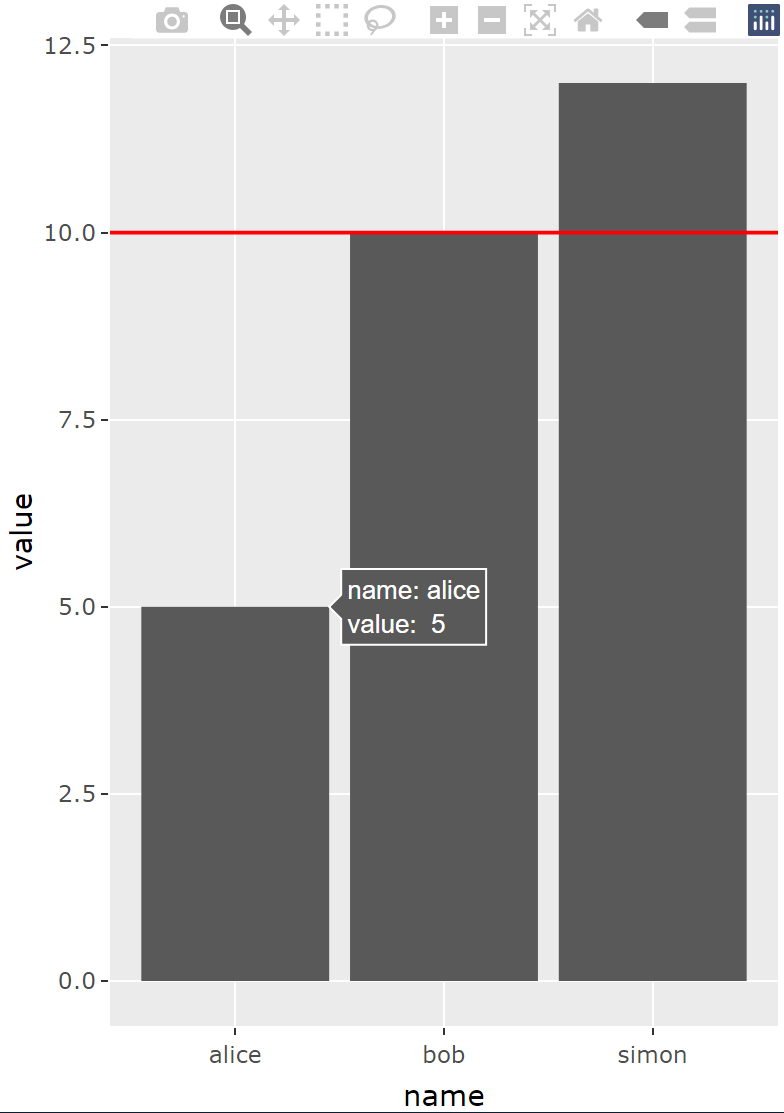
ggplotly works well to plotly-ify my plot and display the information within the tooltip when the bars are hovered over.
But how can I get the tooltip to display the red line as well? Like when you hover over the red line, you will see something like "lineval: 10"
Reprex:
library(ggplot2)
library(plotly)

mydf <- data.frame("name"=c("alice","bob","simon"),
                   "value"=c(5,10,12))

lineval <- 10

myplot <- ggplot(mydf, aes(x=name, y=value))+
  geom_col()+
  geom_hline(yintercept=lineval, color="red")

ggplotly(myplot)