Hi Friends, I wanted to highlight a certain section of a line based on its y/x axis value.
This is using echarts4r package, because I want the interactivity of the plot.
sample link: Examples - Apache ECharts
Thank you in advance for the help!
Hi Friends, I wanted to highlight a certain section of a line based on its y/x axis value.
This is using echarts4r package, because I want the interactivity of the plot.
sample link: Examples - Apache ECharts
Thank you in advance for the help!
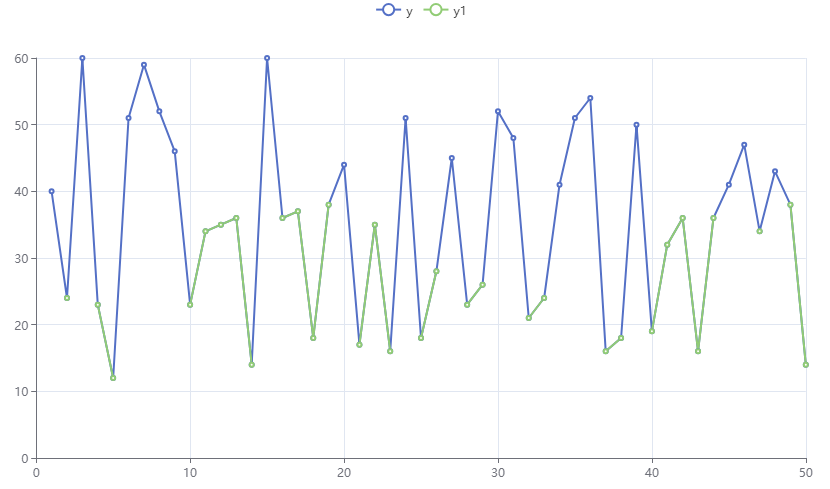
Below is an example that adds a new variable (y1) to the data set that meets a specific condition (< 40 in this case). The new variable is then referenced in a second e_line().
library(echarts4r)
library(dplyr)
set.seed(123)

df = data.frame(x = seq(50),
                y = sample(10:60, 50, replace = T)
                ) |>
  mutate(y1 = ifelse(y < 40, y, NA))

df |>
  e_charts(x) |>
  e_line(y) |>
  e_line(y1)
Thank again @scottyd22 for a quick and robust solution.
So we simply overlap the original geometry with another geometry.
Parth
This topic was automatically closed 21 days after the last reply. New replies are no longer allowed.
If you have a query related to it or one of the replies, start a new topic and refer back with a link.