e_mark_line function query w.r.t given example "echarts4r" Package

Dear friends,
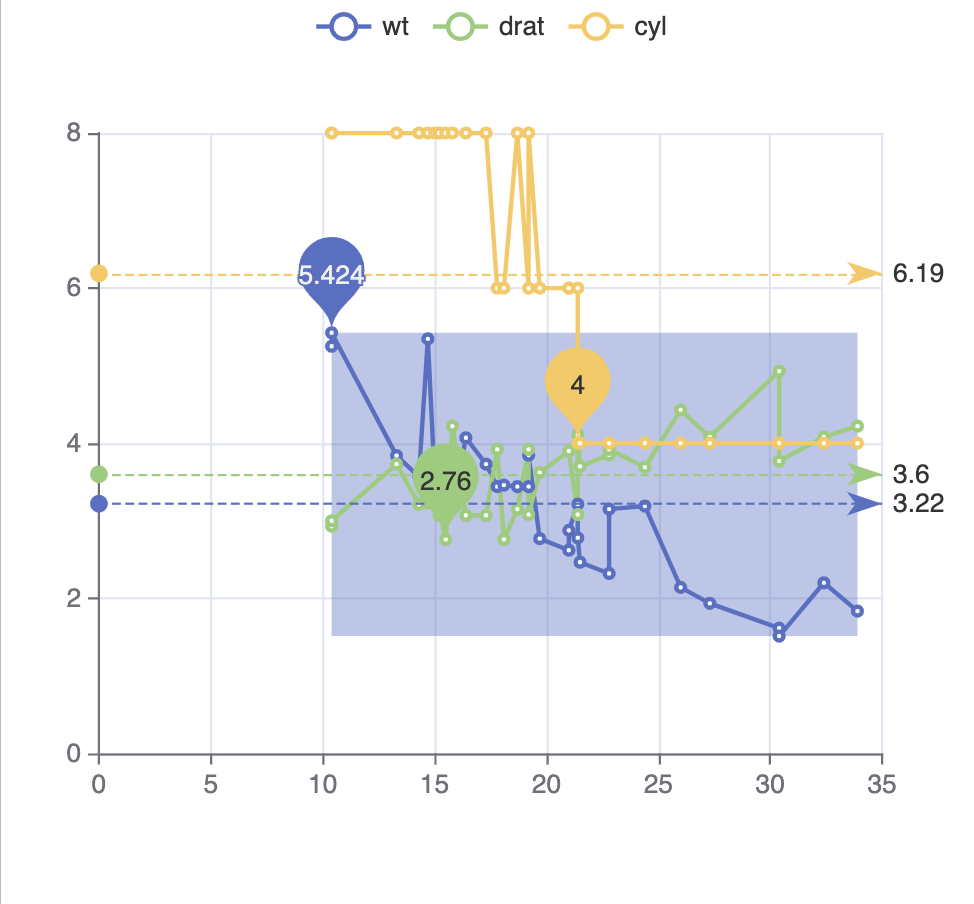
Please review the following code. It produces line race plot (line race with titles).

My question is how a list containing no numerical value when assigned to map mark lines generates numbers.
I would really appreciate if you can explain especially the e_mark_line part and its use.

Thanks in advance.
Parth

CODE

max <- list(
name = "Max",
type = "max"
)

min <- list(
name = "Min",
type = "min"
)

avg <- list(
type = "average",
name = "AVG"
)

mtcars |>
e_charts(mpg) |>
e_line(wt) |>
e_line(drat) |>
e_line(cyl) |>
e_mark_point("wt", data = max) |>
e_mark_point(c("cyl", "drat"), data = min) |>
e_mark_line(data = avg) |> # applies to all
e_mark_area(
serie = "wt",
data = list(
list(xAxis = "min", yAxis = "min"),
list(xAxis = "max", yAxis = "max")
)
)

Here's [a reprex. See the FAQ](https://forum.posit.co/t/faq-how-to-do-a-minimal-

To illustrate the question

is because e_mark_line is an argument to the echarts4r object class derived from mtcars, which encapsulates all of the numeric data in mtcars. This illustrates one of the pitfalls of the convenient |> and %>% operators, which is that objects can be implicit.

The signature for e_mark_line

e_mark_line(
  e,
  serie = NULL,
  data = NULL,
  ...,
  title = NULL,
  title_position = NULL
)

takes e as its required argument (e is an echart4r object), and that is hidden from view by

which is, in effect, e as if

e_mark_line(e, data = avg_)

Here's an interior view of e for these data

library(echarts4r)
str(e_charts(mtcars,mpg))
#> List of 8
#>  $ x            :List of 10
#>   ..$ theme   : chr ""
#>   ..$ tl      : logi FALSE
#>   ..$ draw    : logi TRUE
#>   ..$ renderer: chr "canvas"
#>   ..$ mapping :List of 3
#>   .. ..$ x        : chr "mpg"
#>   .. ..$ x_class  : chr "numeric"
#>   .. ..$ include_x: logi TRUE
#>   ..$ events  : list()
#>   ..$ buttons : list()
#>   ..$ opts    :List of 2
#>   .. ..$ yAxis:List of 1
#>   .. .. ..$ :List of 1
#>   .. .. .. ..$ show: logi TRUE
#>   .. ..$ xAxis:List of 1
#>   .. .. ..$ :List of 1
#>   .. .. .. ..$ type: chr "value"
#>   ..$ data    :List of 1
#>   .. ..$ :'data.frame':  32 obs. of  11 variables:
#>   .. .. ..$ mpg : num [1:32] 10.4 10.4 13.3 14.3 14.7 15 15.2 15.2 15.5 15.8 ...
#>   .. .. ..$ cyl : num [1:32] 8 8 8 8 8 8 8 8 8 8 ...
#>   .. .. ..$ disp: num [1:32] 472 460 350 360 440 ...
#>   .. .. ..$ hp  : num [1:32] 205 215 245 245 230 335 180 150 150 264 ...
#>   .. .. ..$ drat: num [1:32] 2.93 3 3.73 3.21 3.23 3.54 3.07 3.15 2.76 4.22 ...
#>   .. .. ..$ wt  : num [1:32] 5.25 5.42 3.84 3.57 5.34 ...
#>   .. .. ..$ qsec: num [1:32] 18 17.8 15.4 15.8 17.4 ...
#>   .. .. ..$ vs  : num [1:32] 0 0 0 0 0 0 0 0 0 0 ...
#>   .. .. ..$ am  : num [1:32] 0 0 0 0 0 1 0 0 0 1 ...
#>   .. .. ..$ gear: num [1:32] 3 3 3 3 3 5 3 3 3 5 ...
#>   .. .. ..$ carb: num [1:32] 4 4 4 4 4 8 3 2 2 4 ...
#>   ..$ dispose : logi TRUE
#>  $ width        : NULL
#>  $ height       : NULL
#>  $ sizingPolicy :List of 7
#>   ..$ defaultWidth : chr "100%"
#>   ..$ defaultHeight: NULL
#>   ..$ padding      : num 0
#>   ..$ fill         : NULL
#>   ..$ viewer       :List of 6
#>   .. ..$ defaultWidth : NULL
#>   .. ..$ defaultHeight: NULL
#>   .. ..$ padding      : NULL
#>   .. ..$ fill         : logi TRUE
#>   .. ..$ suppress     : logi FALSE
#>   .. ..$ paneHeight   : NULL
#>   ..$ browser      :List of 5
#>   .. ..$ defaultWidth : NULL
#>   .. ..$ defaultHeight: NULL
#>   .. ..$ padding      : NULL
#>   .. ..$ fill         : logi TRUE
#>   .. ..$ external     : logi FALSE
#>   ..$ knitr        :List of 3
#>   .. ..$ defaultWidth : NULL
#>   .. ..$ defaultHeight: NULL
#>   .. ..$ figure       : logi FALSE
#>  $ dependencies : NULL
#>  $ elementId    : NULL
#>  $ preRenderHook:function (e)  
#>  $ jsHooks      : list()
#>  - attr(*, "class")= chr [1:2] "echarts4r" "htmlwidget"
#>  - attr(*, "package")= chr "echarts4r"

Created on 2023-02-17 with reprex v2.0.2

How can I use e_mark_line or e_mark_p function to have running marker with the other than avg, min or max. For eg. what I if want to use category labels as line marker?

Example.
library(babynames)

df = babynames %>% filter(name %in% c("Mary"), sex == "F")
df$year = as.factor(df$year)

Average marker

df %>% group_by(name) %>%
e_chart(x = year, color = c("#984EA3")) %>%
e_line(serie = n) %>%
e_legend(show = F) %>%
e_mark_p(type = "line", data = list(type = "average"))

The line represents the constant average. Here I wanted to display name value ("Mary").
Is this possible to achieve?

I don't see a way in echart4r. It could be done in {ggplot2} if the animation is not required.

Okay,
Thank you for the quick reply.

Regards,
PT

This topic was automatically closed 21 days after the last reply. New replies are no longer allowed.

If you have a query related to it or one of the replies, start a new topic and refer back with a link.