Editing Kable Table

I want change Color the first Column in the kable Table using the code below. what addition line code
can I use to change the color .

New_Table1<-Table1%>%
  mutate(rate_Change=cell_spec(rate_Change,
        background=ifelse(rate_Change>0, "red", "green")))%>%
   dplyr::rename("% change\ncases"=rate_Change)%>%
   dplyr::rename("District"=district)%>%
    dplyr::rename("Date last Report Case"=last_case)%>%
   dplyr::rename("last 7days Case"=last7day_case)%>%
   dplyr::rename("last 14days Case"=last14day_case)%>%
   knitr::kable(format = "html", escape = FALSE, booktabs= T, linesep= "")%>%
   kable_styling(bootstrap_options="condensed", full_width=FALSE, position="center", latex_options="scale_down", font_size=20, font(color="black"))

I think some sample data would help. A handy way to supply some sample data is the dput() function. In the case of a large dataset something like dput(head(mydata, 100)) should supply the data we need. Just do dput(mydata) where mydata is your data. Copy the output and paste it here between
```

```

`Hello John

Please find the attached my sample data set

 district  last_case last7day_case last14day_case rate_Change
       balaka 2024-03-16            32             37       -13.5
     blantyre 2024-03-17           197            253       -22.1
   chiradzulu 2024-03-15            33             33         0.0
      chitipa 2024-03-16           211            221        -4.5
        dedza 2024-03-15            13             15       -13.3
      karonga 2024-03-17          1301           1687       -22.9
      kasungu       -Inf             0             24      -100.0
       likoma 2024-03-15           171            211       -19.0
     lilongwe 2024-03-16           302            488       -38.1
     machinga 2024-03-17            72             75        -4.0
     mangochi 2024-03-17           235            264       -11.0
      mchinji 2024-03-16            88             94        -6.4
 mzimba north 2024-03-15           165            186       -11.3
 mzimba south 2024-03-16            37             41        -9.8
         neno 2024-03-15             3              7       -57.1
   nkhata bay 2024-03-17           374            510       -26.7
   nkhotakota 2024-03-15           221            221         0.0
       ntcheu 2024-03-13             5              5         0.0
     phalombe 2024-03-14             8              8         0.0
       rumphi 2024-03-14            27            129       -79.1
       thyolo 2024-03-16            43             56       -23.2
        zomba 2024-03-17            26             26         0.0
        Total          -          3564           4591       -22.4

``

`Hello John

Please find the attached my sample data set that you can reproduce to outcome with the kable table

 district  last_case last7day_case last14day_case rate_Change
       balaka 2024-03-16            32             37       -13.5
     blantyre 2024-03-17           197            253       -22.1
   chiradzulu 2024-03-15            33             33         0.0
      chitipa 2024-03-16           211            221        -4.5
        dedza 2024-03-15            13             15       -13.3
      karonga 2024-03-17          1301           1687       -22.9
      kasungu       -Inf             0             24      -100.0
       likoma 2024-03-15           171            211       -19.0
     lilongwe 2024-03-16           302            488       -38.1
     machinga 2024-03-17            72             75        -4.0
     mangochi 2024-03-17           235            264       -11.0
      mchinji 2024-03-16            88             94        -6.4
 mzimba north 2024-03-15           165            186       -11.3
 mzimba south 2024-03-16            37             41        -9.8
         neno 2024-03-15             3              7       -57.1
   nkhata bay 2024-03-17           374            510       -26.7
   nkhotakota 2024-03-15           221            221         0.0
       ntcheu 2024-03-13             5              5         0.0
     phalombe 2024-03-14             8              8         0.0
       rumphi 2024-03-14            27            129       -79.1
       thyolo 2024-03-16            43             56       -23.2
        zomba 2024-03-17            26             26         0.0
        Total          -          3564           4591       -22.4

``

I may have something you can work with. Thanks for the data but it was a bit of a mess. you really should use dput(). See the data in dput format below.

I have radically changed your program mainly because I do not normally use {dplyr} and I could not get those dplyr::rename() statements to work. Instead of using {dplyr} I used {data.table}. The syntax is rather different so you may want to have a look at A data.table and dplyr tour to see what I am doing.

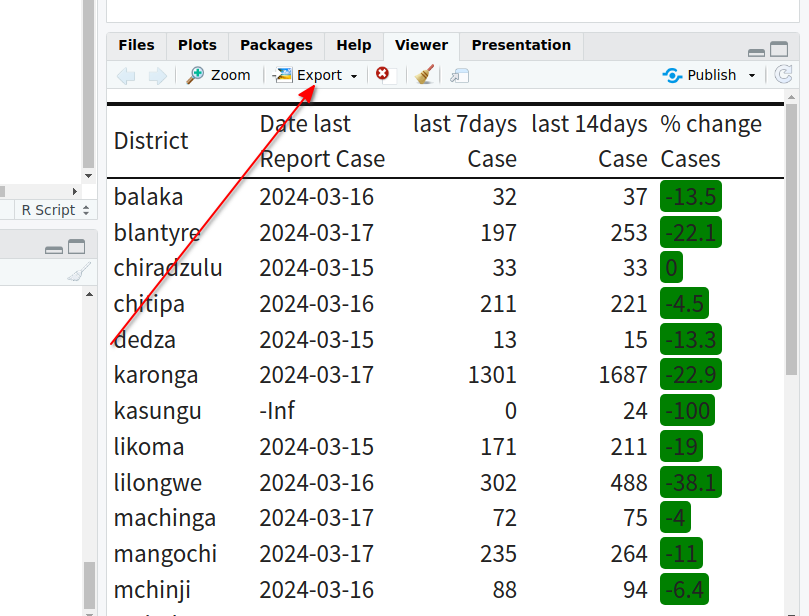
I have produced two tables, Table1 uses kable_classic() which is closest to the "booktabs" format that is only available for LaTeX. Table2 uses the standard kable_styling() format.

I changed

cell_spec(rate_Change,  background=ifelse(rate_Change > 0, "red", "green"))

to

cell_spec(rate_Change,   background=ifelse(rate_Change >= 0, "red", "green"))

just to check that the statement was working. Your data has no rate_Change > 0 . You will want to change it back. For some reason I do not understand "% change\ncases" in not giving a line break.

suppressMessages(library(data.table))
suppressMessages(library(tidyverse))
suppressMessages(library(kableExtra))

setDT(Table1)  # Convert data.frame to data.table to data.table 
Table1[, rate_Change := cell_spec(rate_Change, 
        background=ifelse(rate_Change >= 0, "red", "green"))]

setnames(Table1, c("rate_Change", "district", "last_case", "last7day_case", "last14day_case"), 
c("% change\nCases","District", "Date last Report Case", "last 7days Case", "last 14days Case"))


 New_Table1 <-Table1  %>%   kbl(format  =  "html", escape  =  FALSE ) %>%
   kable_classic(full_width = FALSE,  position = "center",  font_size = 20)  %>%  
     row_spec(22, extra_css = "border-bottom: 2px solid;")
 New_Table1 
 
  New_Table2 <-Table1  %>%   kbl(format  =  "html", escape  =  FALSE ) %>%
   kable_styling(full_width = FALSE,  position = "center",  font_size = 20)  %>%  
     row_spec(22, extra_css = "border-bottom: 2px solid;")
 New_Table2 
 

##=========================Data===================================##
Table1 <- structure(list(district = c("balaka", "blantyre", "chiradzulu",
"chitipa", "dedza", "karonga", "kasungu", "likoma", "lilongwe",
"machinga", "mangochi", "mchinji", "mzimba north", "mzimba south",
"neno", "nkhata bay", "nkhotakota", "ntcheu", "phalombe", "rumphi",
"thyolo", "zomba", "Total"), last_case = c(" 2024-03-16", " 2024-03-17",
" 2024-03-15", " 2024-03-16", " 2024-03-15", " 2024-03-17", " -Inf",
" 2024-03-15", " 2024-03-16", " 2024-03-17", " 2024-03-17", " 2024-03-16",
" 2024-03-15", " 2024-03-16", " 2024-03-15", " 2024-03-17", " 2024-03-15",
" 2024-03-13", " 2024-03-14", " 2024-03-14", " 2024-03-16", " 2024-03-17",
" -"), last7day_case = c(32L, 197L, 33L, 211L, 13L, 1301L, 0L,
171L, 302L, 72L, 235L, 88L, 165L, 37L, 3L, 374L, 221L, 5L, 8L,
27L, 43L, 26L, 3564L), last14day_case = c(37L, 253L, 33L, 221L,
15L, 1687L, 24L, 211L, 488L, 75L, 264L, 94L, 186L, 41L, 7L, 510L,
221L, 5L, 8L, 129L, 56L, 26L, 4591L), rate_Change = c(-13.5,
-22.1, 0, -4.5, -13.3, -22.9, -100, -19, -38.1, -4, -11, -6.4,
-11.3, -9.8, -57.1, -26.7, 0, 0, 0, -79.1, -23.2, 0, -22.4)), class = "data.frame", row.names = c(NA,
-23L))

Thanks a a lot however faced another challenge when I was try to save the table using the below code

New_Table3%>%
  save_kable(file = "Table1.jpeg", 
             zoom=10)

below is the error it is giving

Error: rsession-utf8.exe: GeometryDoesNotContainImage `C:\Users

is there another way to save it

Is there another way to save it?

I don't know. I managed to save it using

New_Table1 <-Table1  %>%   kbl(format  =  "html", escape  =  FALSE ) %>%
   kable_classic(full_width = FALSE,  position = "center",  font_size = 20)  %>%  
     row_spec(22, extra_css = "border-bottom: 2px solid;")  %>%  
         save_kable(" New_Table1.pdf")

after I installed the {webshot2} package. I received a warning after trying it without the package but I was not getting an error message as you are.

I am not a Windows use so I am not clear on what that error message means but try

 install.packages("webshot2") 

and see what happens.

save_kable("New_Table1.png") 

also works but the .pdf looks better.

You should also be able to save the output by using the "Export" button.

I'll keep poking around and see what I can find.

Sorry to take so long getting bark to you but I was not having any more luck with kableExtra.

If you are not committed to {kableExtra} then I may have a solution for you with {flextable}. I think I found a couple of bugs but if you can function with just the table inserted into a document such as RMarkdown or even Word, I think this will work.

My possible bugs. flextime output is strange and is stripping caption.

Table1 <-  read.csv("raw.data.csv") 

# names changed for my convenience
names(Table1) <- c("district", "last", "last7", "last14", "rate")

set_flextable_defaults(
  font.family = "Arial", font.size = 10, 
  border.color = "black")


tb1 <- flextable(Table1) |> 
  bold(part = "header") |> 
      color(~ rate  < 0, color = "green", ~ rate) |> 
       color(~ rate  >= 0, color = "red", ~ rate) 


tb1 <- set_header_labels(
  x = tb1,
  values = c(
    district = "District",
    last = "Date of Last Case",
    last7 = "Cases in last 7 days",
    last14 = "Cases in last 14 days",
    rate = "% Change"
  )
)

set_table_properties(tb1, width = .5, layout = "autofit")

save_as_image(tb1, "tb1.png")


Aha! Finally figured out how to add a horizontal line and centre the column headings.

Sightly revised version

suppressMessages(library(data.table))
# suppressMessages(library(tidyverse))
suppressMessages(library(flextable))
suppressMessages(library(officer))

Table1 <-  read.csv("raw.data.csv") 

# names changed for my convenience
names(Table1) <- c("district", "last", "last7", "last14", "rate")

set_flextable_defaults(
  font.family = "Arial", font.size = 10, 
  border.color = "black")

std_border <- fp_border(color = "red")

tb1 <- flextable(Table1) |> 
  bold(part = "header") |> 
      color(~ rate  < 0, color = "green", ~ rate) |> 
       color(~ rate  >= 0, color = "red", ~ rate) 

tb1 <- align(tb1, align = "center", part = "header")
tb1 <- hline(tb1, i = 22, j = 1:5, border = std_border)

tb1 <- set_header_labels(
  x = tb1,
  values = c(
    district = "District",
    last = "Date of Last Case",
    last7 = "Cases in last 7 days",
    last14 = "Cases in last 14 days",
    rate = "% Change"
  )
)

set_table_properties(tb1, width = .75, layout = "autofit")


save_as_image(tb1, "tb1.png")

1 Like

Thank a lot John it really help on saving the table as an image

Check my {flextable} selections.

This topic was automatically closed 7 days after the last reply. New replies are no longer allowed.

If you have a query related to it or one of the replies, start a new topic and refer back with a link.