Teles
March 26, 2023, 8:17pm
1
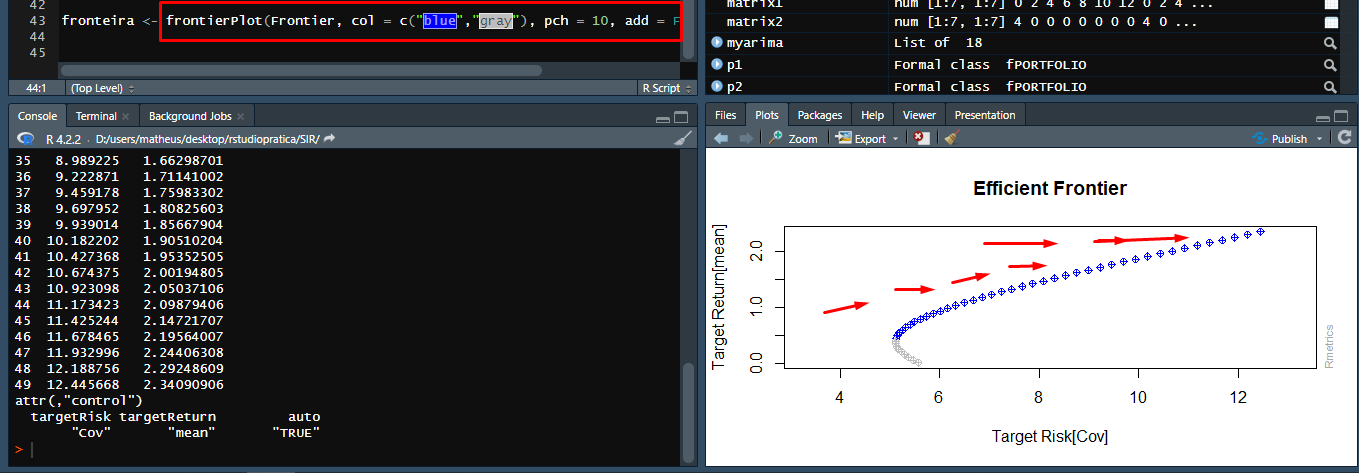
Anyone can help me to put results in graphic? Any point of the graphic represent a result, See in the image is too good, How can I do it using frontierPlot?
Hi @Teles , maybe this link could help you.
Remember put a reproducible example understand well the data.
A minimal reproducible example consists of the following items:
A minimal dataset, necessary to reproduce the issue
The minimal runnable code necessary to reproduce the issue, which can be run
on the given dataset, and including the necessary information on the used packages.
Let's quickly go over each one of these with examples:
Teles
March 28, 2023, 1:23am
3
I'ts good, but I need more details in graph, but thanks It's better now
system
April 18, 2023, 1:24am
4
This topic was automatically closed 21 days after the last reply. New replies are no longer allowed.