I created a scatter plot using following data:
dput(plot_df_1)
structure(list(samples = c("Aug-01", "Sep-01", "Oct-01", "Nov-01",
"Aug-02", "Sep-02", "Oct-02", "Nov-02", "Aug-03", "Sep-03", "Oct-03",
"Nov-03"), pcoa1 = c(0.190438129449005, 0.253276282924123, 0.0246195929847479,
0.00788842485758788, 0.0269614471832893, 0.000140155324667924,
0.0954317633965768, 0.0436598938436388, 0.00476818535960686,
0.00557702541876294, 0.106553387148706, 0.11910636118432), pcoa2 = c(0.00141971241687974,
0.116481439630919, 0.0205307911452035, 0.000206374218265552,
0.186419611939673, 0.194274107809662, 0.00916679980857703, 0.00526599722259877,
0.00137572216532783, 0.00206212384496798, 0.0870866417037191,
0.0214556775348287), Months = c("red", "blue", "orange", "black",
"red", "blue", "orange", "black", "red", "blue", "orange", "black")),
row.names = c(NA, -12L), class = c("tbl_df", "tbl", "data.frame"))
print(plot_df_1)
A tibble: 12 × 4
samples pcoa1 pcoa2 Months
1 Aug-01 0.190 0.00142 red
2 Sep-01 0.253 0.116 blue
3 Oct-01 0.0246 0.0205 orange
4 Nov-01 0.00789 0.000206 black
5 Aug-02 0.0270 0.186 red
6 Sep-02 0.000140 0.194 blue
7 Oct-02 0.0954 0.00917 orange
8 Nov-02 0.0437 0.00527 black
9 Aug-03 0.00477 0.00138 red
10 Sep-03 0.00558 0.00206 blue
11 Oct-03 0.107 0.0871 orange
12 Nov-03 0.119 0.0215 black
ggplot(plot_df_1, aes(x=pcoa1, y=pcoa2)) +
geom_point(aes(color = as.factor(samples))) +
labs(x="PCo 1 (69.9%)", y="PCo 2 (42.5%)") +
scale_color_manual(
values = c("Aug-01" = "red", "Sep-01" = "blue", "Oct-01" = "orange", "Nov-01" = "black",
"Aug-02" = "red", "Sep-02" = "blue", "Oct-02" = "orange", "Nov-02" = "black",
"Aug-03" = "red", "Sep-03" = "blue", "Oct-03" = "orange", "Nov-03" = "black")) +
geom_mark_ellipse(aes(group = samples, fill = "Months"))
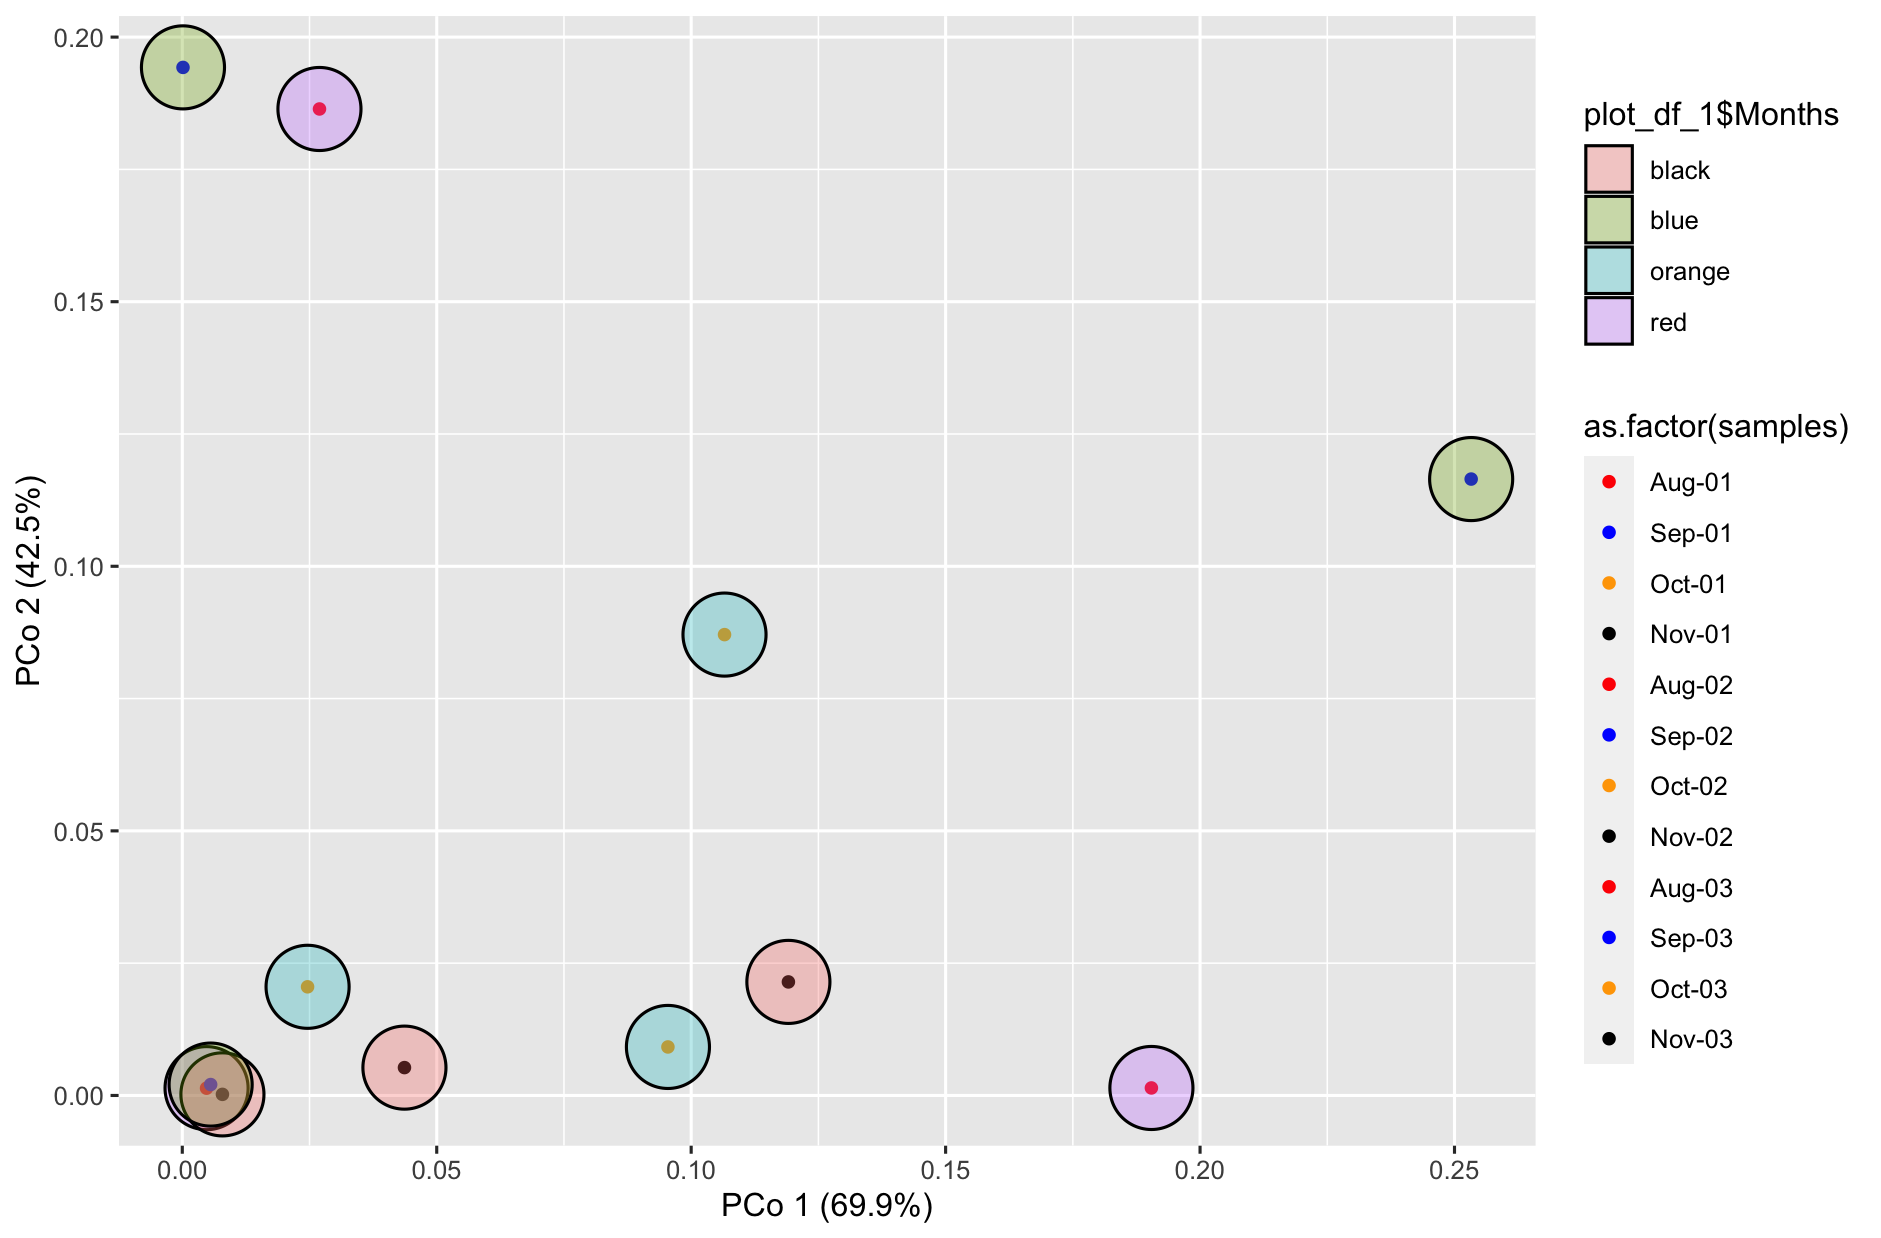
I wan to add ellipses which shall cluster my samples as given in the graph legend and fill color of ellipses would be according to the "Months" column of my tibble as given above.
Can someone please tell the error in my script as I am unable to add ellipses correctly.
Regards
Hira