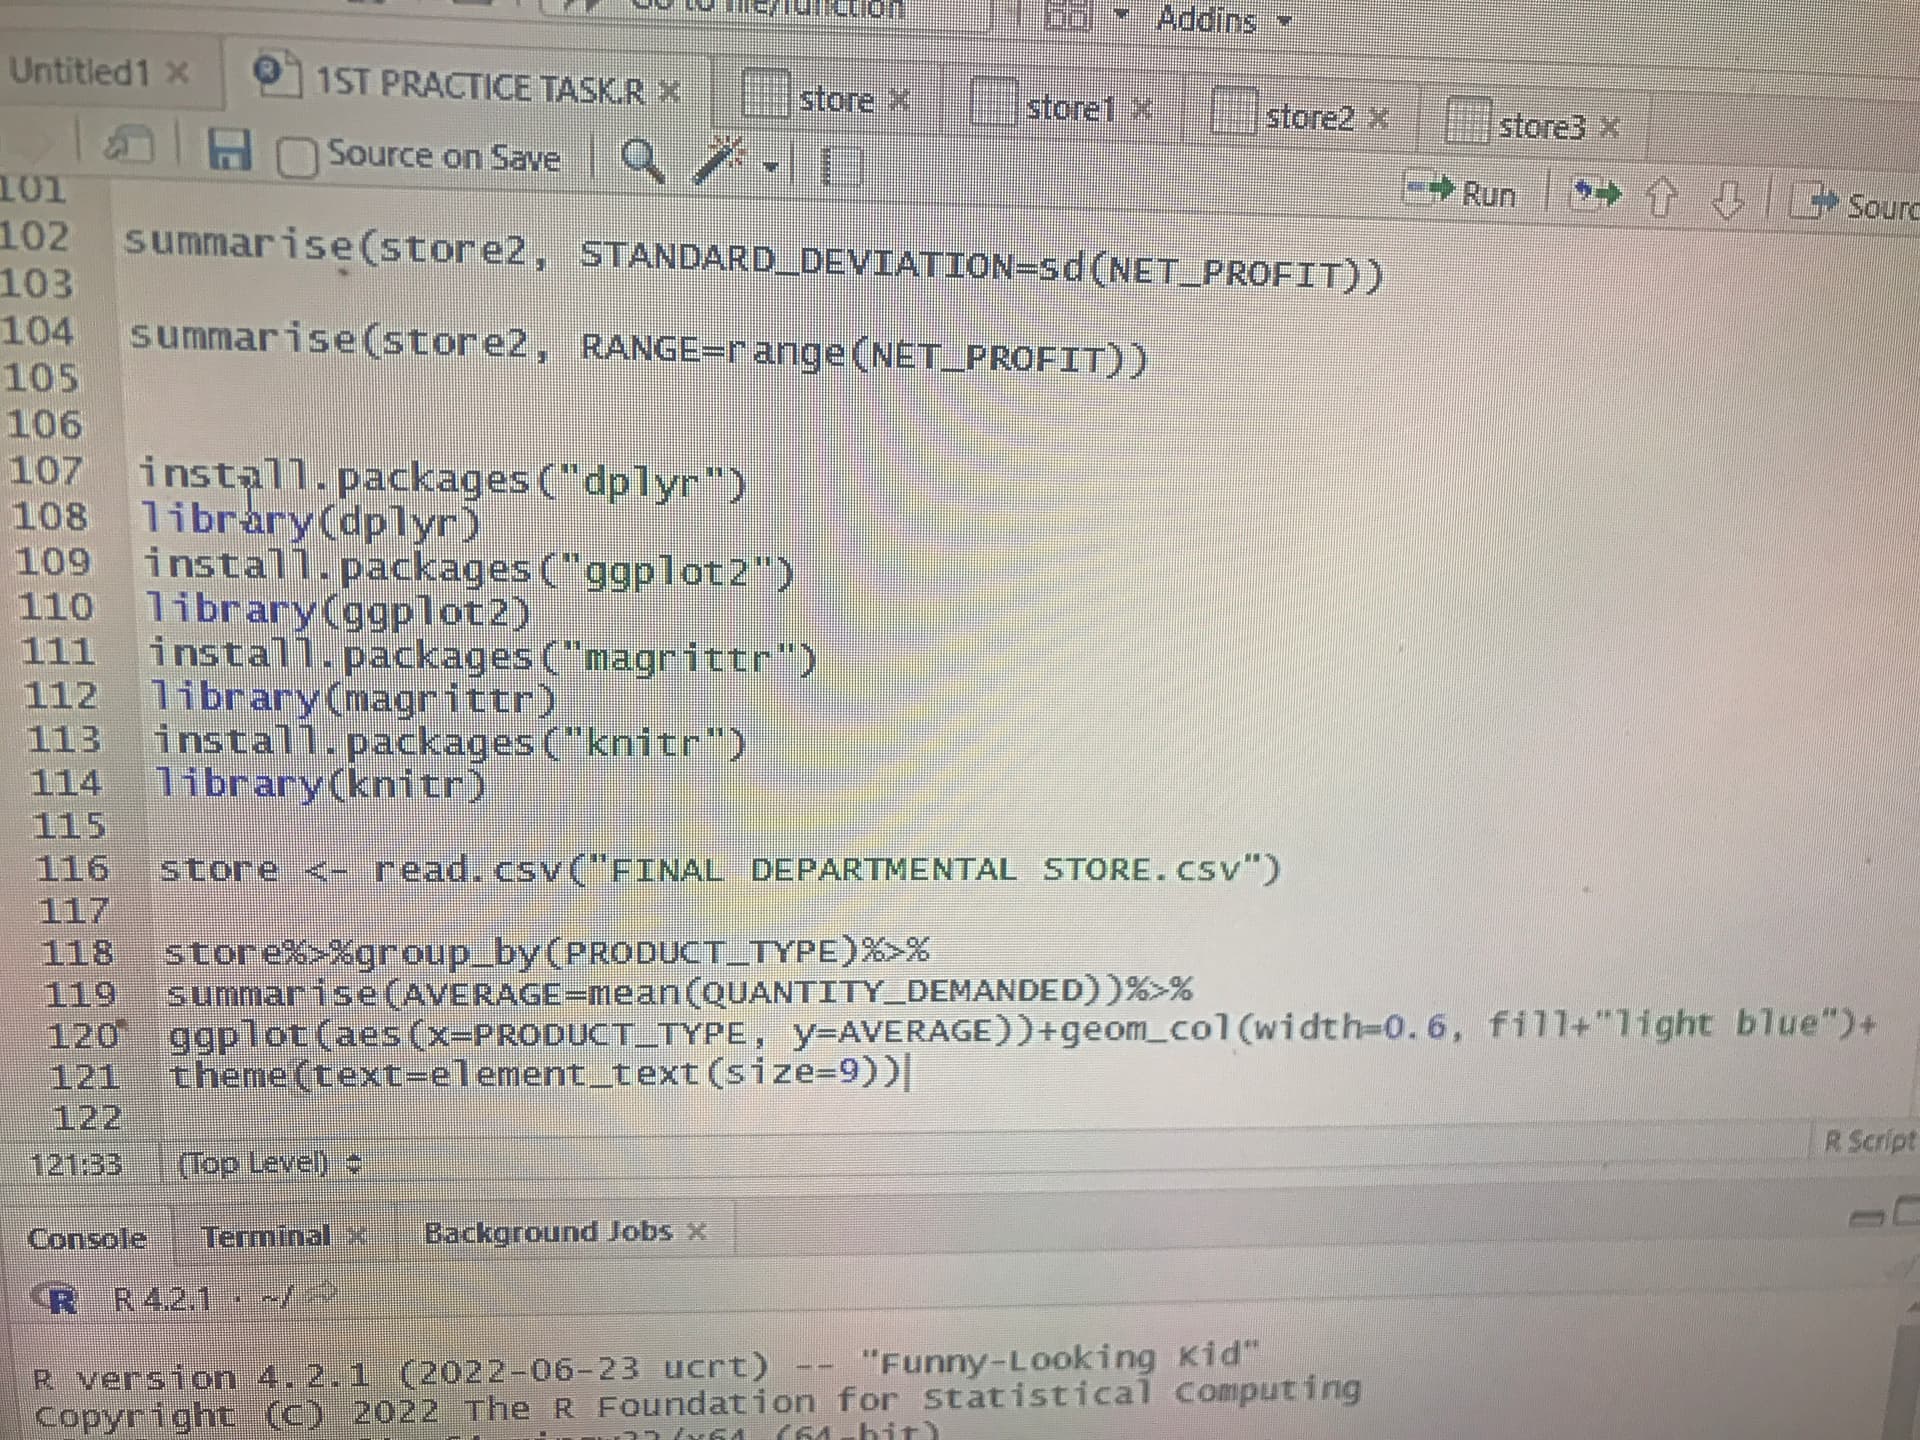
So I am trying to work with a dataset to help me transform my data in viz but anytime I run the function I get error code the function %>% could not be found. I have install.pacakages(“Magrittr”) and (“knitr”) installed but I still get the same error code when I run a function with the pipe %>% function in it.
Any one want to help me understand why this is happening ?
After installing magrittr, you have to load it
library(magrittr)
Recent versions of R have a built in pipe, |>
1 Like
Yes I did load both knitr and magrittr library’s separately yet I still have the same problem
Ok guess I will have to update R to the latest version then.. thanks
Just checked and I’m using the latest version of R.. so what could be the problem
Please show your actual code.
try adding spaces, ex: store %>% group_by()
1 Like
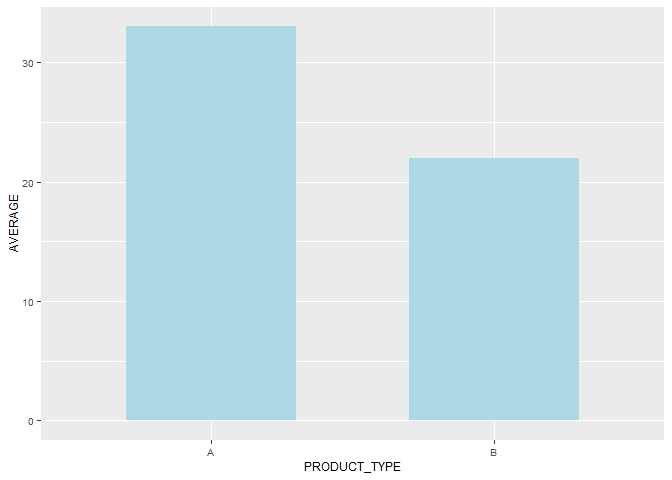
The following code works for me. All I changed from your code is that I replaced fill + with fill = in geom_col(). I invented the data frame store since you have not posted any data. I only loaded the packages ggplot2 and dplyr since dplyr calls magrittr.
library(dplyr)
#>
#> Attaching package: 'dplyr'
#> The following objects are masked from 'package:stats':
#>
#>     filter, lag
#> The following objects are masked from 'package:base':
#>
#>     intersect, setdiff, setequal, union
library(ggplot2)
store <- data.frame(PRODUCT_TYPE=c("A","A","B","B"),
                    QUANTITY_DEMANDED=c(22,44,33,11))
store%>%group_by(PRODUCT_TYPE)%>%
  summarise(AVERAGE = mean(QUANTITY_DEMANDED))%>%
  ggplot(aes(x = PRODUCT_TYPE, y = AVERAGE)) + geom_col(width = 0.6, fill = "light blue") +
  theme(text = element_text(size = 9))
Created on 2022-11-01 with reprex v2.0.2
2 Likes
I have done that and still having the same error in store %<% : could not find function “%<%”
That’s really helpful but my problem is R can’t update packages on magrittr which has left me so clueless of what to do, because I have done everything possible to write the right syntax to get the packages updated but I keep getting the same error code “%>%” function not found.
Does this work for you?
library(dplyr)
library(ggplot2)
store <- data.frame(PRODUCT_TYPE=c("A","A","B","B"),
                    QUANTITY_DEMANDED=c(22,44,33,11))
store |> group_by(PRODUCT_TYPE) |>
  summarise(AVERAGE = mean(QUANTITY_DEMANDED)) |>
  ggplot(aes(x = PRODUCT_TYPE, y = AVERAGE)) + geom_col(width = 0.6, fill = "light blue") +
  theme(text = element_text(size = 9))
2 Likes
Double check: %>% not %<%.
And just to try: load the tidyverse library
EDIT
Try to open a new r script and paste this code: does it works? If yes the problem is somewhere in your code
library(tidyverse)

test <- tibble(
  a = sample(1:100, 10),
  b = sample(200:300, 10)
)

test %>%
  mutate(c = case_when(a < 50 & b < 250 ~ "min",
                       T ~ "max")) %>%
  filter(c == "max") %>%
  head(., 4)
2 Likes
Sorry I made a typo mistake when writing “%>%” but I thought of installing tidyverse packages.. will give you any feedback as soon as I try it out again. Thanks
If loading tidyverse does not help, consider changing to the new base R pipe |> as suggested by FJCC. It is supported by the version of R that you a running.
1 Like
So some way some how after I waited for magrittr to install and restarted my machine the pipe function and other functions are working correctly.. I must say I’m really glad I can find help from people so quickly to help me understand whatever problem I’m having.
Also, just so you know, the pipe keyboard shortcut is Ctrl+Shift+M on a PC.
1 Like
FYI I had the same problem recently and for me loading tidyverse was the solution.
Try loading the magrittr package first, and then load the tidy verse library to avoid confusing the pipe command
Ira
So I will ask a co-worker to chime in but the issue might be a package load issue. I have noticed from reprex() command that certain libraries are force reloading in different versions of rlang and vctrs
For me having tidyverse or magrittr be called first seems to have fixed though.