Error in gList(...) : only 'grobs' allowed in "gList"

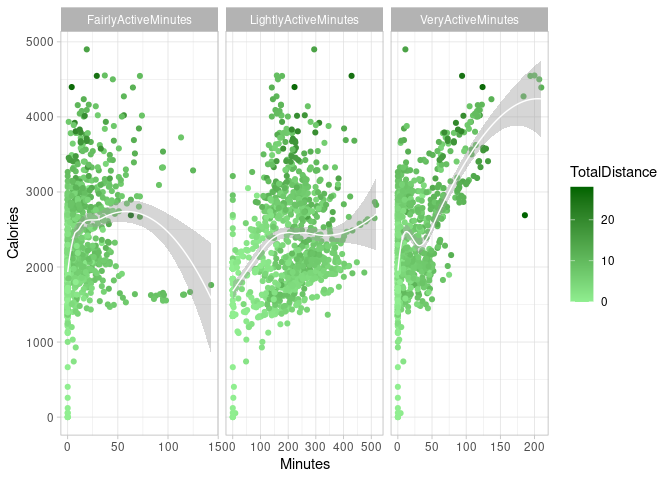
LightlyActive <- ggplot(data=daily_activity_all,
                        aes(x=LightlyActive, y=Calories, color=TotalDistance)) +
  geom_point() +
  scale_color_gradient(low = "lightgreen", high="darkgreen", na.value="white") +
  geom_smooth(method=loess, color="white", size=0.5) +
  labs (title = "Lightly Active")
#> Error in ggplot(data = daily_activity_all, aes(x = LightlyActive, y = Calories, : could not find function "ggplot"

FairlyActive<- ggplot(data=daily_activity_all,
                      aes(x=LightlyActive, y=Calories, color=TotalDistance)) +
  geom_point() +
  scale_color_gradient(low = "lightblue", high="darkblue", na.value="white") +
  geom_smooth(method=loess, color="white", size=0.5) +
  labs (title = "Fairly Active")
#> Error in ggplot(data = daily_activity_all, aes(x = LightlyActive, y = Calories, : could not find function "ggplot"

VeryActive<- ggplot(data=daily_activity_all,
                    aes(x=LightlyActive, y=Calories, color=TotalDistance)) +
  geom_point() +
  scale_color_gradient(low = "khaki", high="indianred", na.value="white") +
  geom_smooth(method=loess, color="white", size=0.5) +
  labs (title = "Very Active")
#> Error in ggplot(data = daily_activity_all, aes(x = LightlyActive, y = Calories, : could not find function "ggplot"

activity_plot <- ggarrange("LightlyActive + theme_void(),
                           FairlyActive + theme_void(),
                           VeryActive + theme_void(), nrow=1, ncol=3)")
#> Error in ggarrange("LightlyActive + theme_void(),\n                           FairlyActive + theme_void(),\n                           VeryActive + theme_void(), nrow=1, ncol=3)"): could not find function "ggarrange"
                           
annotate_figure(activity_plot, bottom=text_grob("Minutes"), 
                left=text_grob("Calories"))
#> Error in annotate_figure(activity_plot, bottom = text_grob("Minutes"), : could not find function "annotate_figure"

@andresrcs at last I learnt to reprex :slight_smile:

so now this code runs down but the annotate_figure plot shows blank. need help!!!

missing leading + sign

1 Like

it still didn't work. I tried with ggarrange and it still doesn't work.

Error in purrr::map(plots, .plot_grid, ncol = ncol, nrow = nrow, labels = labels, : Caused by error in geom_point(): ! Problem while computing aesthetics. :information_source: Error occurred in the 1st layer. Caused by error in check_aesthetics(): ! Aesthetics must be either length 1 or the same as the data (33704) :heavy_multiplication_x: Fix the following mappings: `x

I got this message

A workable reprex needs representative data. Just enough to throw the same error.

The first order is to find out which point() is responsible. Trim up to the first? If ok, the second. If not ok, feed us some data with just so far as the failure point.

LightlyActive <- ggplot(data = daily_activity_all, aes(x = LightlyActive, y = Calories, color = TotalDistance)) + geom_point() + scale_color_gradient(low = "lightgreen", high = "darkgreen", na.value = "white") + geom_smooth(method = loess, color = "lightpink", linewidth = 0.5) + labs(title = "Lightly Active")

FairlyActive<- ggplot(data = daily_activity_all, aes(x = LightlyActive, y = Calories, color = TotalDistance)) + geom_point() + scale_color_gradient(low = "lightblue", high = "darkblue", na.value = "white") + geom_smooth(method = loess, color = "lightpink", linewidth = 0.5) + labs(title = "Fairly Active")

VeryActive<- ggplot(data = daily_activity_all, aes(x = LightlyActive, y = Calories, color = TotalDistance)) + geom_point() + scale_color_gradient(low = "khaki", high = "indianred", na.value = "white") + geom_smooth(method = loess, color = "lightpink", linewidth = 0.5) + labs(title = "Very Active")

activity_plot <- ggarrange("(LightlyActive + theme_void(),
                           FairlyActive + theme_void(),
                           VeryActive + theme_void(), nrow=1, ncol=3)")

annotate_figure(activity_plot, 
                top=text_grob("Activity in Minutes", color = "royalblue", face = "bold", size = 16), 
                bottom=text_grob("Minutes", color = "seagreen", face = "italic", size = 10),
                left=text_grob("Calories", color = "seagreen", face = "italic", size = 10))

so I solved the problem with the code chunk, it run down the code but then the graph I am getting a blank one. like only with the title heading and bottom and left title on the plot but is not showing any plot

Not quite yet, you are still not providing sample data in a proper format to make your example reproducible. Please read the reprex guide more carefully and try again.

Since you are struggling so much with providing a proper reprex I have looked on the internet for the data set you are using so I can make one for you. I think this is what you are trying to do:

library(tidyverse)

file_url <- "https://storage.googleapis.com/kagglesdsdata/datasets/1041311/1752235/Fitabase%20Data%204.12.16-5.12.16/dailyActivity_merged.csv?X-Goog-Algorithm=GOOG4-RSA-SHA256&X-Goog-Credential=gcp-kaggle-com%40kaggle-161607.iam.gserviceaccount.com%2F20230120%2Fauto%2Fstorage%2Fgoog4_request&X-Goog-Date=20230120T111854Z&X-Goog-Expires=259200&X-Goog-SignedHeaders=host&X-Goog-Signature=a3e98818a12f3fa2c7600b8e8ceddefb8f9c62046ac20b0ff89554c0dc9e3000ee5db81a20d263ba3de599a6a88bea808777f6854c11db913e6f9348dae9465a61ef861cfb387e1ac5c55d50d753e25989a6e690a79321e6c557b0b05df3cf458db9629ae23b50c7384015d0dd40b03eddd858ba2e0a59d633905afcd7992965fd595c1fd5a3876f5a796d6b45013fdb857d69d010a94666330a09c83b0139e60178510804bd5fbbe2cf6557bba270a2a0019563ddb98726c0a92c69eac51a0cc978ab11ebd4bec3496f618d5e878191ec41ea6de55af6dfffdac5f634672dbd9c2dda46ddbcf179cba73ba35aa36a08cda8921e48344f5e95dbf3fb5d8b412f"
daily_activity_all <- read.csv(file_url)

daily_activity_all %>% 
    select(ends_with("ActiveMinutes"), Calories, TotalDistance) %>% 
    pivot_longer(cols = ends_with("ActiveMinutes"),
                 names_to = "ActivityLevel",
                 values_to = "Minutes") %>% 
    ggplot(aes(x = Minutes, y = Calories, color = TotalDistance)) +
    geom_point() +
    scale_color_gradient(low = "lightgreen", high="darkgreen", na.value="white") +
    geom_smooth(method=loess, color="white", size=0.5) +
    facet_grid(cols = vars(ActivityLevel), scales = "free_x") +
    theme_light()
#> Warning: Using `size` aesthetic for lines was deprecated in ggplot2 3.4.0.
#> ℹ Please use `linewidth` instead.
#> `geom_smooth()` using formula = 'y ~ x'

Created on 2023-01-20 with reprex v2.0.2

But to clarify what the problems with your code were:

  • All three plots were mapping the same variable (i.e. LightlyActive) to the x-axis so they were basically the same plot with different titles.
  • ggarrange() expects a list of plots not a character string

ok :frowning: thank you so much for explaining my error and going for all the trouble.