Hi,
I am trying to output a grid plot using ggplot2 in R studio with available R script. But, I come across a below error.
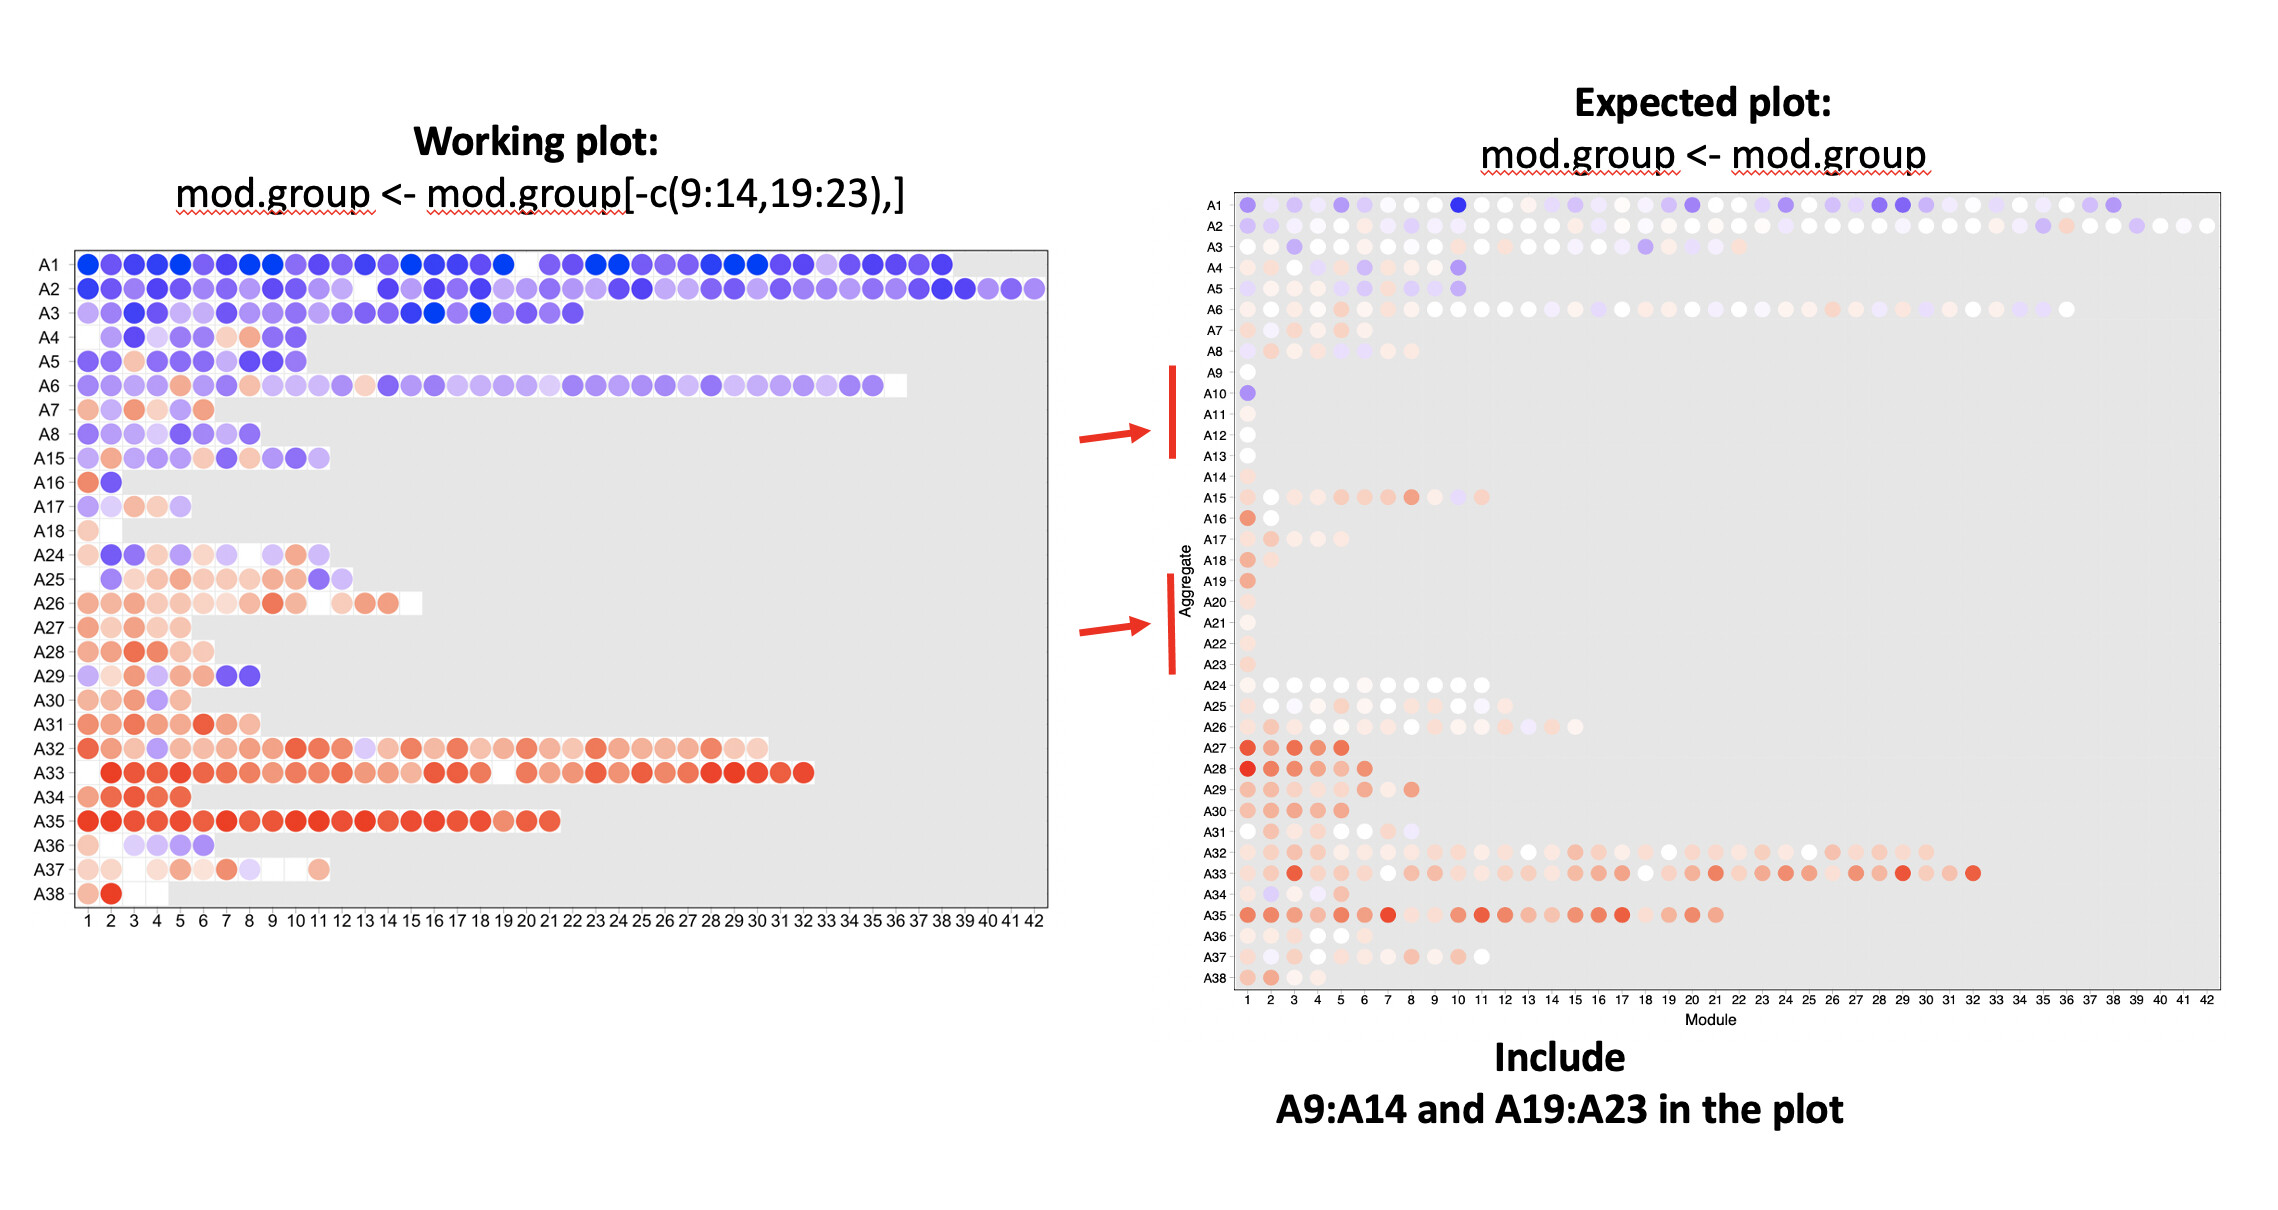
Error: Aesthetics must be either length 1 or the same as the data (1596): fill
In the working plot, I excluded rows A9:A14, A19:A23. In the expected plot, I would like to include all rows.
Data for Working plot
cluster remove module that have only 1 module
mod.group <- mod.group[-c(9:14,19:23),]
Data for Non-working/error plot to include all rows
mod.group <- mod.group
# creat new grid with all filtered cluster##
mod.group <- matrix(nrow=38,ncol=42)
rownames (mod.group) <- paste0("A",c(1:38))
colnames (mod.group) <- paste0("",c(1:42))

## BY cluster
for (i in 1 : nrow(res.mods.group)){
  Mx <- as.numeric(gsub(x = strsplit (rownames(res.mods.group)[i],"\\.")[[1]][[1]],pattern = "A",replacement = ""))
  My <- as.numeric(strsplit (rownames(res.mods.group)[i],"\\.")[[1]][[2]])
  mod.group[Mx,My] <- res.mods.group$TestvsHealthy[i]
}

#cluster remove module that have only 1 module
mod.group <- mod.group[-c(9:14,19:23),]

library(ggplot2)
library(ggsignif)
library(reshape2)

melt_test <- melt(mod.group,id.var=c("row.names"))

################### MODULE MAP COLORs#########################################
dev.new()
png(filename = paste0("Test_Grid.png"), res = 600, height = 5.5, width = 8.5, units = "in")
ggplot(melt_test, aes(Var1, as.factor(Var2))) +
  geom_tile(color="#E6E6E6" , size = 0.2, fill= color)+
  geom_point(aes(colour=value,size=1))+
  theme(axis.text.x = element_text(angle = -90, hjust = 0))+
  labs(title= "Test vs Healthy")+
  ylab("") +
  xlab("") +
  scale_color_gradient2(low = "blue", mid="white", high = "red", limits=c(-100,100),na.value = "#E6E6E6", guide = "colourbar")+
  theme_light() +
  theme(panel.grid.minor = element_line(colour="black", size=0.9))+
  coord_flip() + scale_x_discrete(limits = rev(levels(melt_test$Var1))) +
  theme(panel.border = element_rect(color = "black",size = 0.5),
        axis.text.x = element_text(colour="black",size=9,angle=0,hjust=0.5,vjust=2,face="plain"),
        axis.text.y = element_text(colour="black",size=9,angle=0,hjust=0.5,vjust=0.5,face="plain"))

dev.off()
dim(melt_test)
[1] 1596 3
dput(head(melt_test, 100))
structure(list(Var1 = structure(c(1L, 2L, 3L, 4L, 5L, 6L, 7L,
8L, 9L, 10L, 11L, 12L, 13L, 14L, 15L, 16L, 17L, 18L, 19L, 20L,
21L, 22L, 23L, 24L, 25L, 26L, 27L, 28L, 29L, 30L, 31L, 32L, 33L,
34L, 35L, 36L, 37L, 38L, 1L, 2L, 3L, 4L, 5L, 6L, 7L, 8L, 9L,
10L, 11L, 12L, 13L, 14L, 15L, 16L, 17L, 18L, 19L, 20L, 21L, 22L,
23L, 24L, 25L, 26L, 27L, 28L, 29L, 30L, 31L, 32L, 33L, 34L, 35L,
36L, 37L, 38L, 1L, 2L, 3L, 4L, 5L, 6L, 7L, 8L, 9L, 10L, 11L,
12L, 13L, 14L, 15L, 16L, 17L, 18L, 19L, 20L, 21L, 22L, 23L, 24L
), .Label = c("A1", "A2", "A3", "A4", "A5", "A6", "A7", "A8",
"A9", "A10", "A11", "A12", "A13", "A14", "A15", "A16", "A17",
"A18", "A19", "A20", "A21", "A22", "A23", "A24", "A25", "A26",
"A27", "A28", "A29", "A30", "A31", "A32", "A33", "A34", "A35",
"A36", "A37", "A38"), class = "factor"), Var2 = c(1L, 1L, 1L,
1L, 1L, 1L, 1L, 1L, 1L, 1L, 1L, 1L, 1L, 1L, 1L, 1L, 1L, 1L, 1L,
1L, 1L, 1L, 1L, 1L, 1L, 1L, 1L, 1L, 1L, 1L, 1L, 1L, 1L, 1L, 1L,
1L, 1L, 1L, 2L, 2L, 2L, 2L, 2L, 2L, 2L, 2L, 2L, 2L, 2L, 2L, 2L,
2L, 2L, 2L, 2L, 2L, 2L, 2L, 2L, 2L, 2L, 2L, 2L, 2L, 2L, 2L, 2L,
2L, 2L, 2L, 2L, 2L, 2L, 2L, 2L, 2L, 3L, 3L, 3L, 3L, 3L, 3L, 3L,
3L, 3L, 3L, 3L, 3L, 3L, 3L, 3L, 3L, 3L, 3L, 3L, 3L, 3L, 3L, 3L,
3L), value = c(-100, -94.1176470588235, -38.4615384615385, 0,
-69.5652173913043, -54.5454545454545, 40, -60, -50, -75, -50,
0, -30, -25, -37.7777777777778, 62.5, -42.1052631578947, 27.7777777777778,
20, 22.5806451612903, -22.7272727272727, 18.75, 26.9230769230769,
26.0869565217391, 0, 44.1176470588235, 50, 44.4444444444444,
-35.4166666666667, 40, 60, 79.1666666666667, 0, 50, 100, 30,
23.8095238095238, 37.5, -78.3783783783784, -77.7777777777778,
-56.8965517241379, -44.6808510638298, -63.6363636363636, -47.8260869565217,
-35.2941176470588, -43.3333333333333, NA, NA, NA, NA, NA, NA,
45.4545454545455, -75, -21.4285714285714, 0, NA, NA, NA, NA,
NA, -75, -55, 39.3939393939394, 27.2727272727273, 50, 20, 38.4615384615385,
50, 51.7241379310345, 100, 77.7777777777778, 100, 0, 22.2222222222222,
100, -90.9090909090909, -57.8947368421053, -91.6666666666667,
-83.3333333333333, 32.4324324324324, -40, 55.5555555555556, -39.7058823529412,
NA, NA, NA, NA, NA, NA, -39.3939393939394, NA, 37.5, NA, NA,
NA, NA, NA, NA, -62.5)), row.names = c(NA, 100L), class = "data.frame")