Error with GGPLOT. What does it mean?

Hello!

For a project I created a tibble to show the number of rides per day of the week:

The tibble has 3 columns, and I created it from a data frame with 500K rows and 19 columns. But for your convenience, and can be created with the following code:

calc_2 <- as_tibble(data.frame(day_of_week = c("Monday", "Tuesday", "Wednesday", "Thursday","Friday", "Saturday", "Sunday"),member_casual = c("casual","member"), ride_count = c(28289,43259,22594,43571,37764,40232,30750,34942,26725,49291,22462,48020,23421,46840)))

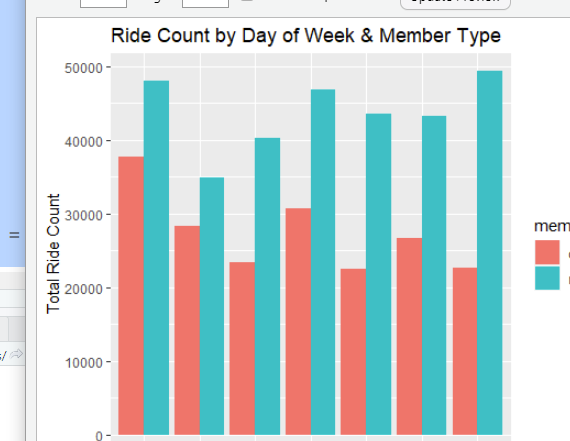
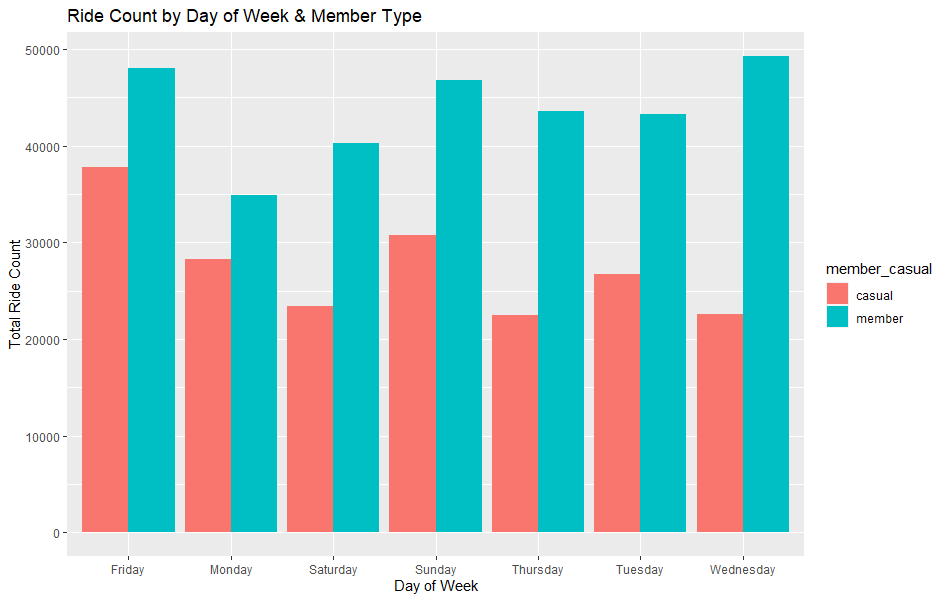
However, when I try to make a simple bar graph for these results, I encounter issues. This is the code I use for the bar graph:

ggplot(data=calc_2, aes(x=day_of_week, y=ride_count, fill=member_casual)) + geom_bar(stat='identity', position = 'dodge') + labs(x = "Day of Week", y = "Total Ride Count", title = "Ride Count by Day of Week & Member Type")

These are the errors I get back:

Error in UseMethod("depth") : **
** no applicable method for 'depth' applied to an object of class "NULL"

OR it says :

Error in grid.Call.graphics(C_upviewport, as.integer(n)) : **
** cannot pop the top-level viewport ('grid' and 'graphics' output mixed?)

How can I change my code to avoid these errors?

Thanks everyone!

1 Like

This is going to be unhelpful...I ran the two lines of code you provided and they worked fine.

library(ggplot2)
library(tidyverse)
calc_2 <-
  as_tibble(data.frame(
    day_of_week = c(
      "Monday",
      "Tuesday",
      "Wednesday",
      "Thursday",
      "Friday",
      "Saturday",
      "Sunday"
    ),
    member_casual = c("casual", "member"),
    ride_count = c(
      28289,
      43259,
      22594,
      43571,
      37764,
      40232,
      30750,
      34942,
      26725,
      49291,
      22462,
      48020,
      23421,
      46840
    )
  ))

ggplot(data = calc_2, aes(x = day_of_week, y = ride_count, fill = member_casual)) + geom_bar(stat =
                                                                                               'identity', position = 'dodge') + labs(x = "Day of Week", y = "Total Ride Count", title = "Ride Count by Day of Week & Member Type")

image

I too had no problem with your code. Try running the menu item Session -> Restart R.

You could try with geom_col()

ggplot(data=calc_2, aes(x=day_of_week, y=ride_count, fill=member_casual)) + 
  geom_col(position = 'dodge') + 
  labs(x = "Day of Week", y = "Total Ride Count", title = "Ride Count by Day of Week & Member Type")

This topic was automatically closed 7 days after the last reply. New replies are no longer allowed.

If you have a query related to it or one of the replies, start a new topic and refer back with a link.