Hi,
I have data
Wavelength	site1	site2
300	       21.92	92.29
365	       18.02	39.85
405	       16.24	23.03
445	       14.78	predict
532	       12.36	predict
635        10.36	predict
780	        8.43    predict
808	        8.14    predict
I need to extrapolate the data for site2 column from wavelengths 445 to 808.
Could anyone tell me how I can do that?
Thanks
startz
2
One way to do it is to use lm() to regress site2 on wavelength and site1. Then use predict().
Thanks,
I tried this,
our_model <- lm(df$site2 ~ df$Wavelength)

predict(our_model, newdata =  data.frame(x = 3))
But, I did not get the desired output
The output comes as with warning
          1           2           3           4           5           6           7           8
  89.910577   46.114905   19.163722   -7.787461  -66.406284 -135.805581 -233.503619 -252.369447
Warning message:
'newdata' had 1 row but variables found have 8 rows
startz
4
Try
prediction <- predict(our_model, newdata = df))
prediction$site1[5:8]
Ven
5
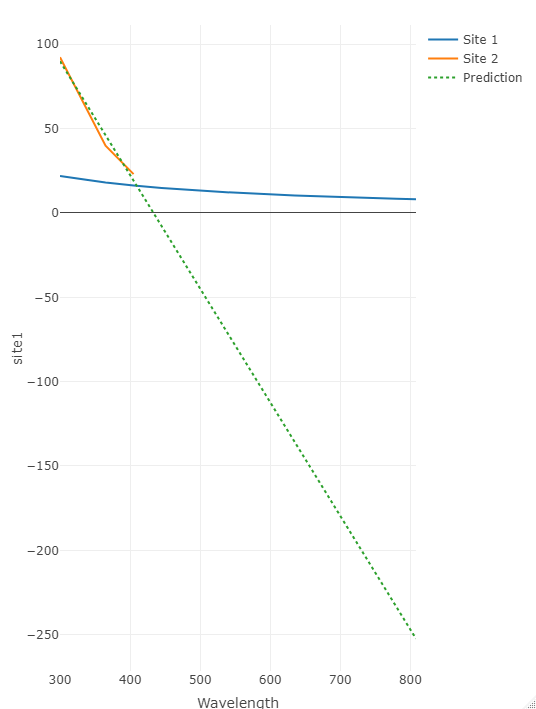
Piggybacking off of @startz's recommendation.
library(data.table)
library(plotly)

dt <- data.table(
 Wavelength = c(300, 365, 405, 445, 532, 635, 780, 808),
 site1 = c(21.92, 18.02, 16.24, 14.78, 12.36, 10.36, 8.43, 8.14),
 site2 = c(92.29, 39.85, 23.03, NA, NA, NA, NA, NA)
)

dt[, pred := predict(lm(dt$site2 ~ dt$Wavelength), newdata = dt)]

dt |>
 plot_ly(x = ~ Wavelength) |>
 add_lines(y = ~ site1, name = "Site 1") |>
 add_lines(y = ~ site2, name = "Site 2") |>
 add_lines(y = ~ pred,
           name = "Prediction",
           line = list(dash = "dot"))
system
Closed
6
This topic was automatically closed 21 days after the last reply. New replies are no longer allowed.
If you have a query related to it or one of the replies, start a new topic and refer back with a link.