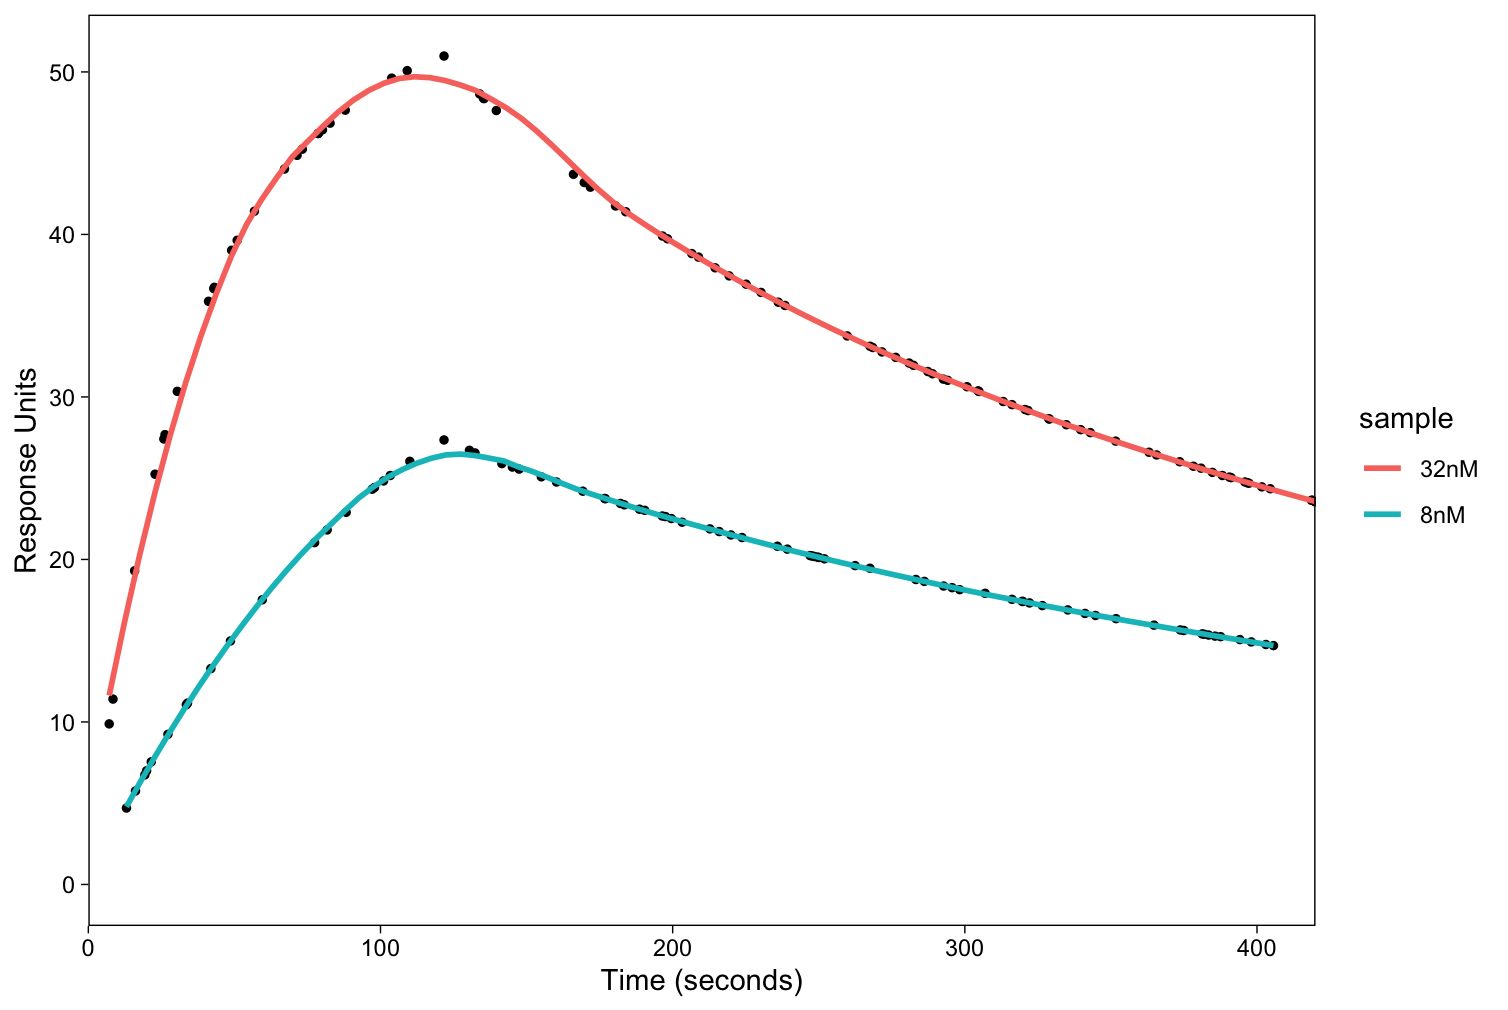
I am trying to fit association-dissociation SPR kinetics data for a protein and small molecule for two concentrations using ggplot2. The data is here. The time variable indicates the time in seconds, the sample variable indicates the two concentrations (32nM and 8nM), and the values variable is the readout.
I have imported the data and running the following code to plot:
ggplot(data) +
  geom_point(aes(x = time, y = values), size = 1, color = "black") +
  geom_smooth(aes(x = time, y = values, color = sample), method = "loess", se = F) +
  scale_x_continuous(expand = c(0, 0), limits = c(0, NA)) +
  #scale_y_continuous(expand = c(0, 0), limits = c(0, 60)) +
  scale_color_npg(breaks = c("2nM", "4nM", "8nM", "16nM", "32nM")) +
  theme_linedraw() +
  labs(x = "Time (seconds)",
       y = "Response Units") +
  theme(panel.grid.major = element_blank(),
        panel.grid.minor = element_blank())
Here is the plot:
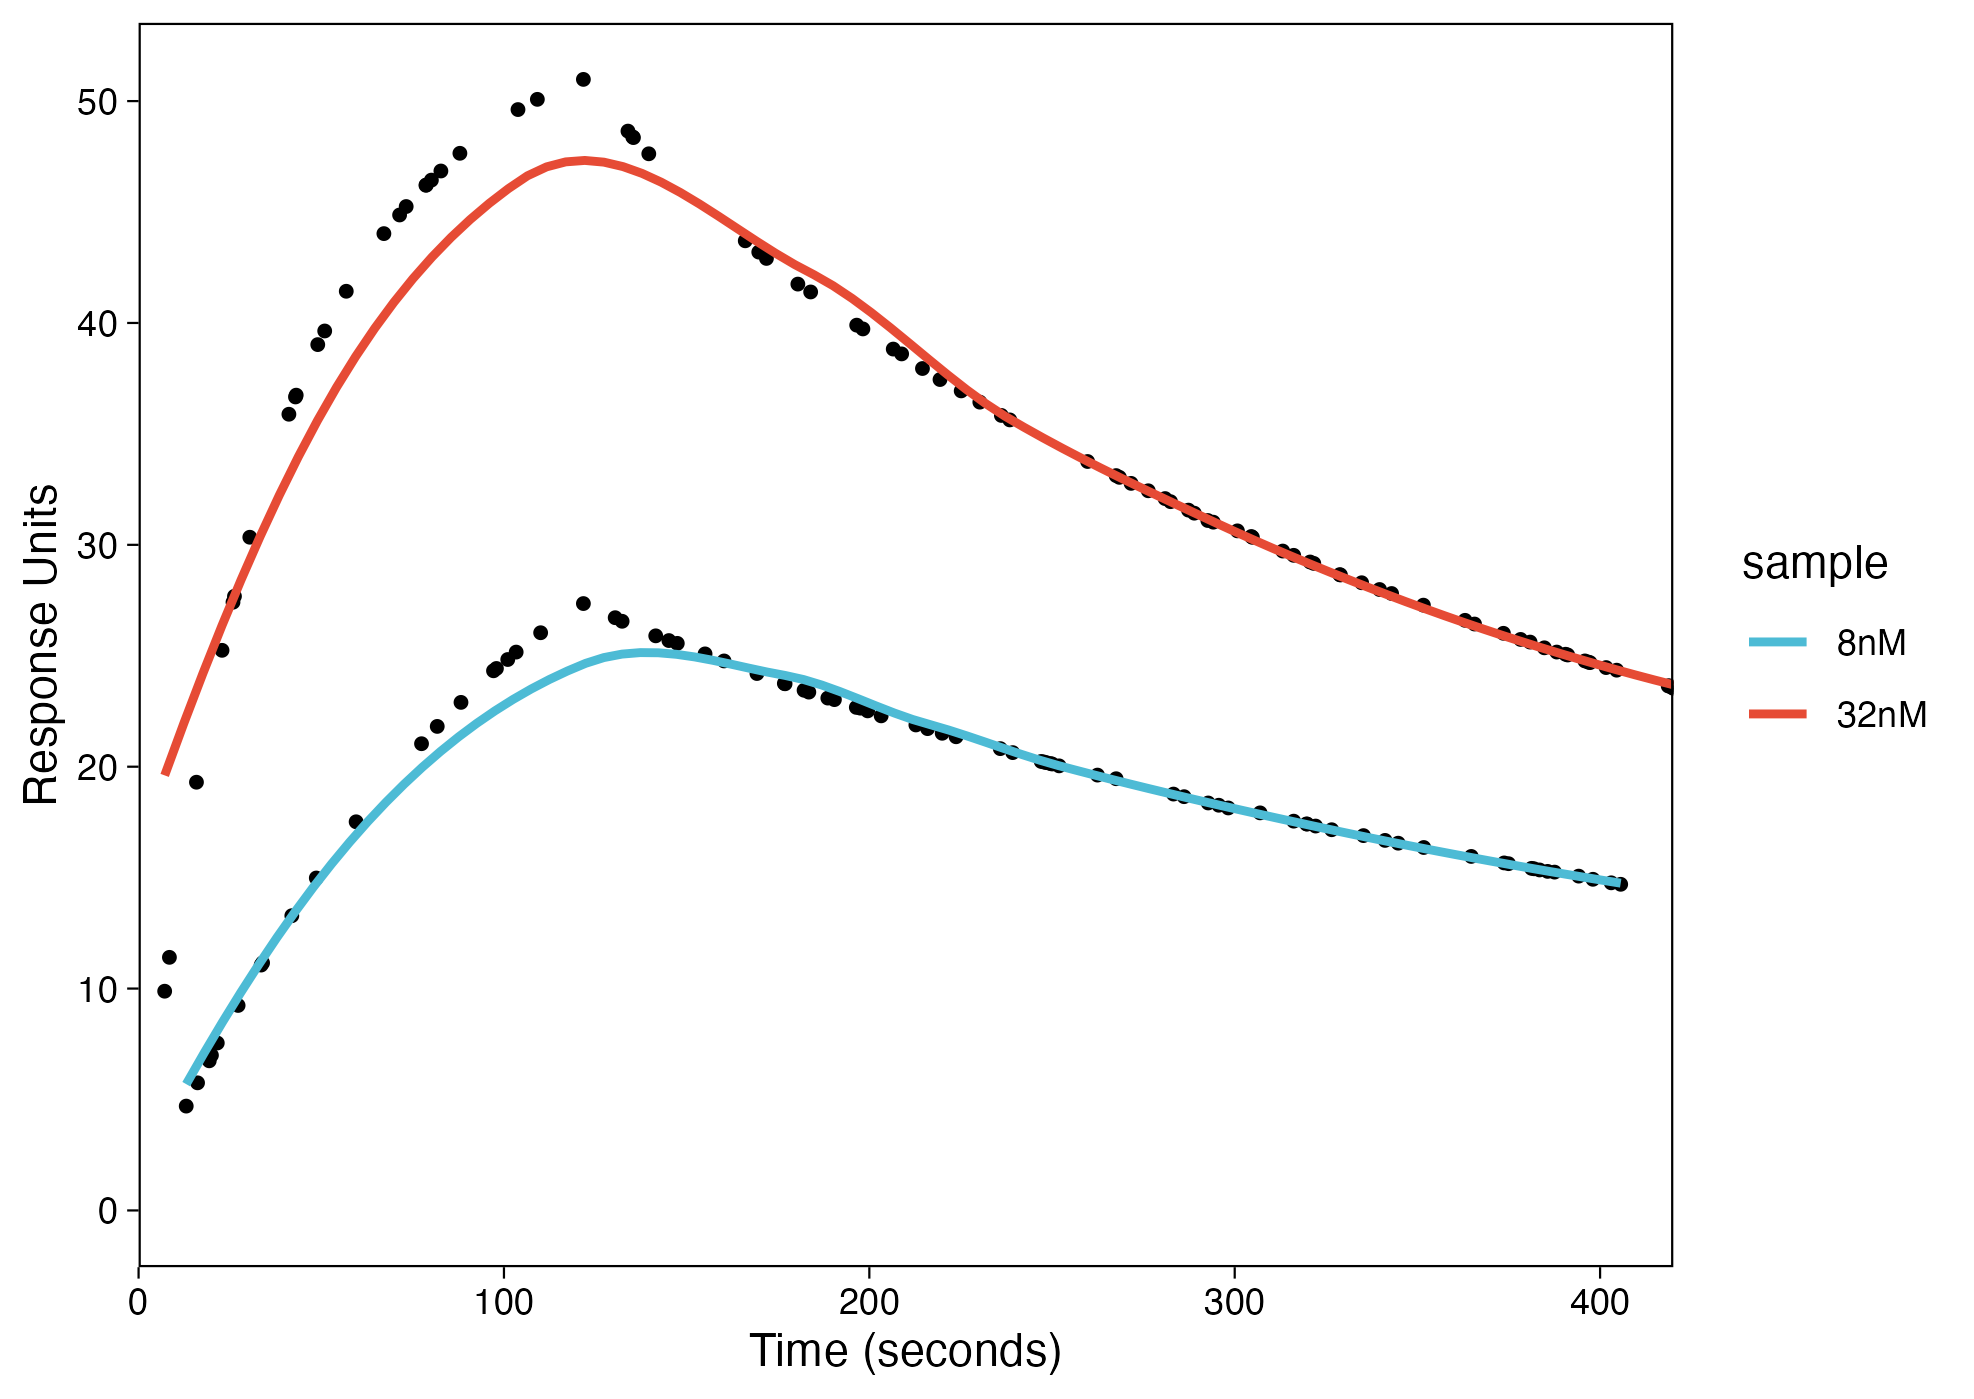
As you can see that the fit did not work using
method = "loess".The fitting requires 1:1 Langmuir model but I am not sure how I can do that in
ggplot. Can someone please help me?