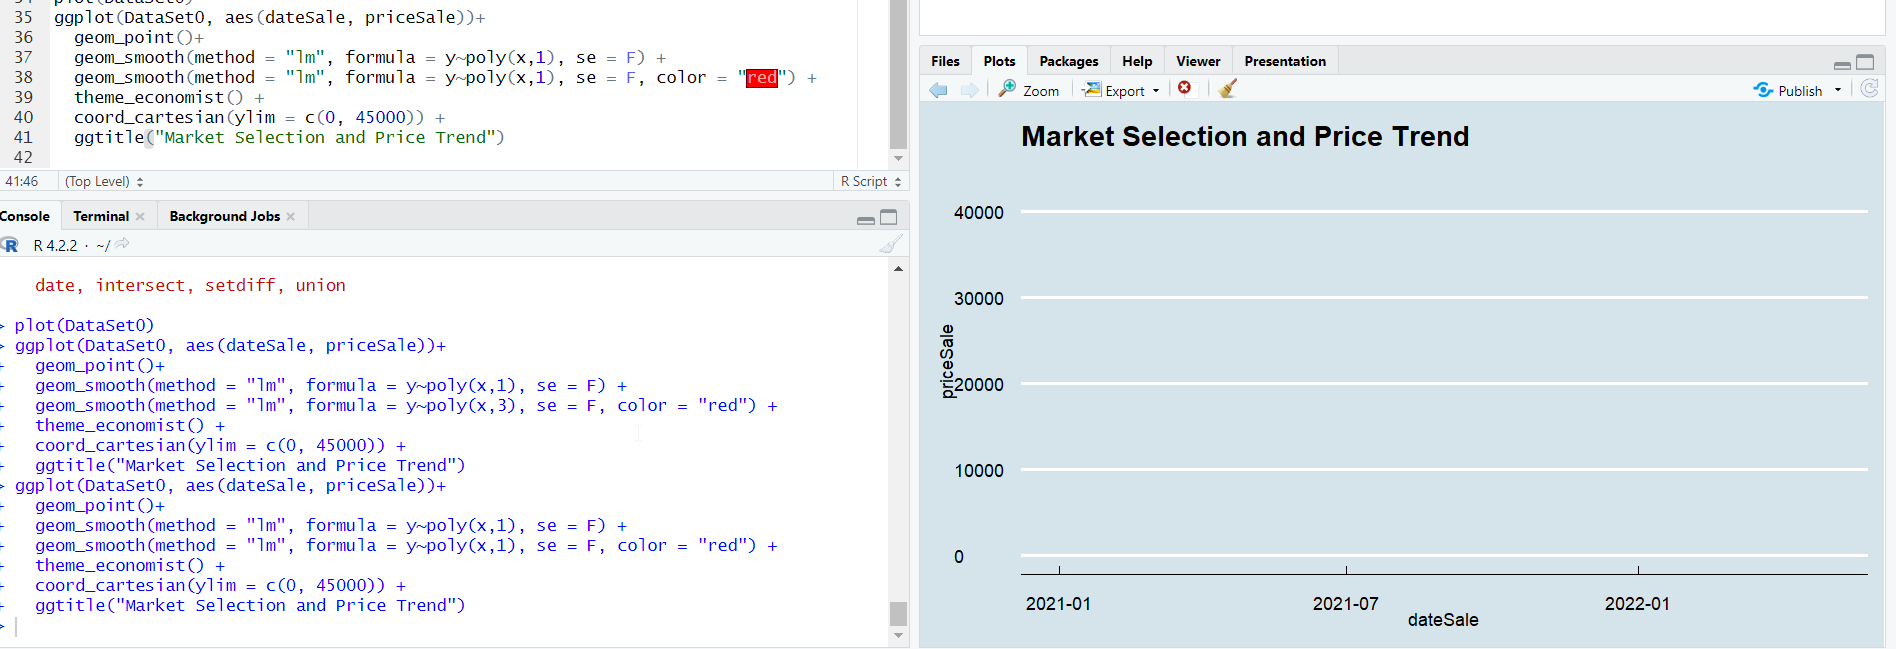
Ah, I see I misread the limits! However I am now getting
library(ggplot2)
library(ggthemes)
dat1 <- structure(list(dateSale = structure(c(1632009600, 1614211200,
1651449600, 1618617600, 1648080000, 1636934400, 1633737600, 1.62e+09,
1621728000, 1644019200, 1609459200, 1612483200, 1623888000, 1646870400,
1637539200), class = c("POSIXct", "POSIXt"), tzone = "UTC"),
priceSale = c(2e+05, 262000, 255000, 260000, 260000, 280000,
295000, 305000, 310000, 325000, 329000, 329000, 329900, 335000,
356000)), class = c("tbl_df", "tbl", "data.frame"), row.names = c(NA, -15L))
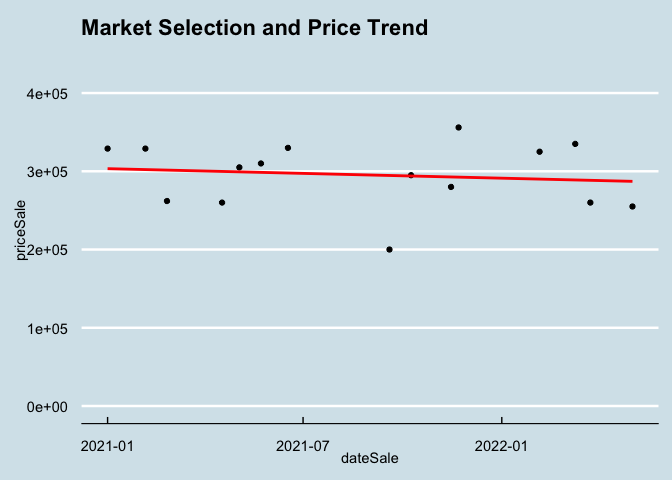
ggplot(dat1, aes(dateSale, priceSale))+
geom_point()+
geom_smooth(method = "lm", formula = y~poly(x,1), se = F, color = "red") +
theme_economist() +
coord_cartesian(0, 450000) +
ggtitle("Market Selection and Price Trend")
#> Error: Invalid input: time_trans works with objects of class POSIXct only
Created on 2023-01-18 with reprex v2.0.2
What is that doing? dateSale is POSIXct