Hi, I am puzzled as to how curve() function works with getting the x variable, can't seem to know how to replicate for geom_curve() I feel a bit confused on how to approach the problem.
Here the code works:
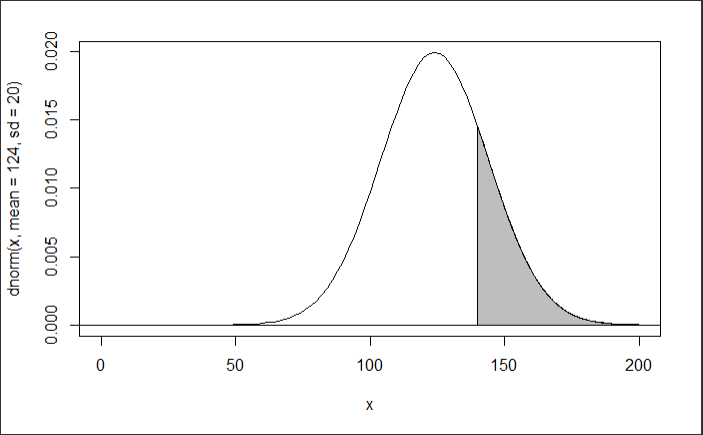
curve(dnorm(x, mean = 124, sd = 20), xlim = c(0, 200))
abline(h = 0)
sequence <- seq(140, 200, 0.1)
polygon(x = c(sequence,200,140),
        y = c(dnorm(c(sequence),124,20),0,0),
        col = "grey")
Which results in
and then with ggplot
sequence <- seq(140, 200, 0.1)
ggplot() +
  geom_curve(dnorm(x, mean = 124, sd = 20), xlim = c(0, 200)) +
  geom_abline(h = 0) +
  geom_polygon(mapping = aes(x = c(sequence,200,140),
                             y = c(dnorm(c(sequence),124,20),0,0),
                             color = "grey"))
give the following error:
"Error in dnorm(x, mean = 124, sd = 20) : Object 'x' not found"