ggplot data R timeseries

I have this dataset: x and i want to convert it into a timeseries with a facet wrap on the customer group. something like

ggplot(df, aes(x=df$'Date', y= df$Sales quantity, color = df$Customer group, group = df$Customer group))+
geom_line() +
facet_wrap(~df$Customer group)+
theme_classic()+
theme()

but this looks like:


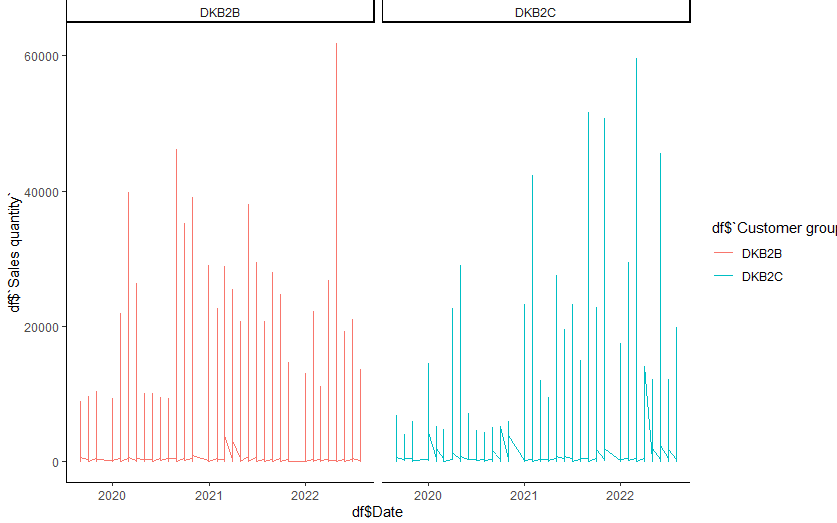
so it return to 0 every date guess it is because the are some missing dates in between? any suggestions to make this a bit more like a normal time series?

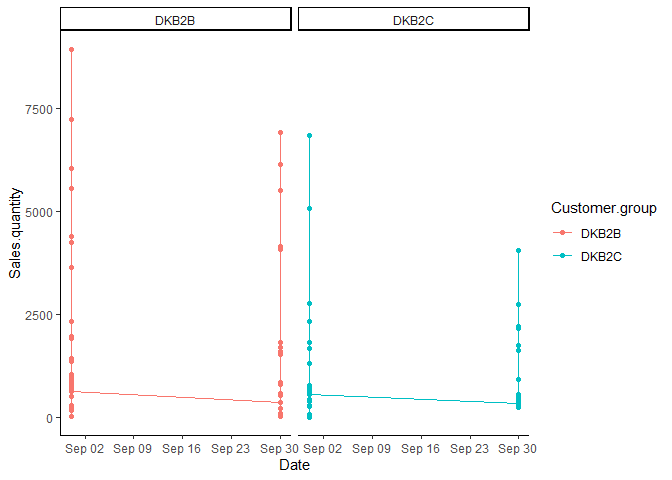
The problem is that you have several Sales.quantity values at each date with a large range of values. The line between dates simply connects the last point of one date to the first point of the next date. Both values are usually low, though not always, as can be seen in the occasional diagonal line. Here is a graph showing your first 100 points.

library(ggplot2)

df <- read.csv("~/R/Play/dft.csv")
df$Date <- as.Date(df$Date)
df2 <- df[1:100,]
ggplot(df2, aes(x=Date, y= `Sales.quantity`, color = `Customer.group`, group = `Customer.group`))+
  geom_line() + geom_point() +
  facet_wrap(~`Customer.group`)+
  theme_classic()

Created on 2022-09-02 with reprex v2.0.2

This topic was automatically closed 7 days after the last reply. New replies are no longer allowed.

If you have a query related to it or one of the replies, start a new topic and refer back with a link.